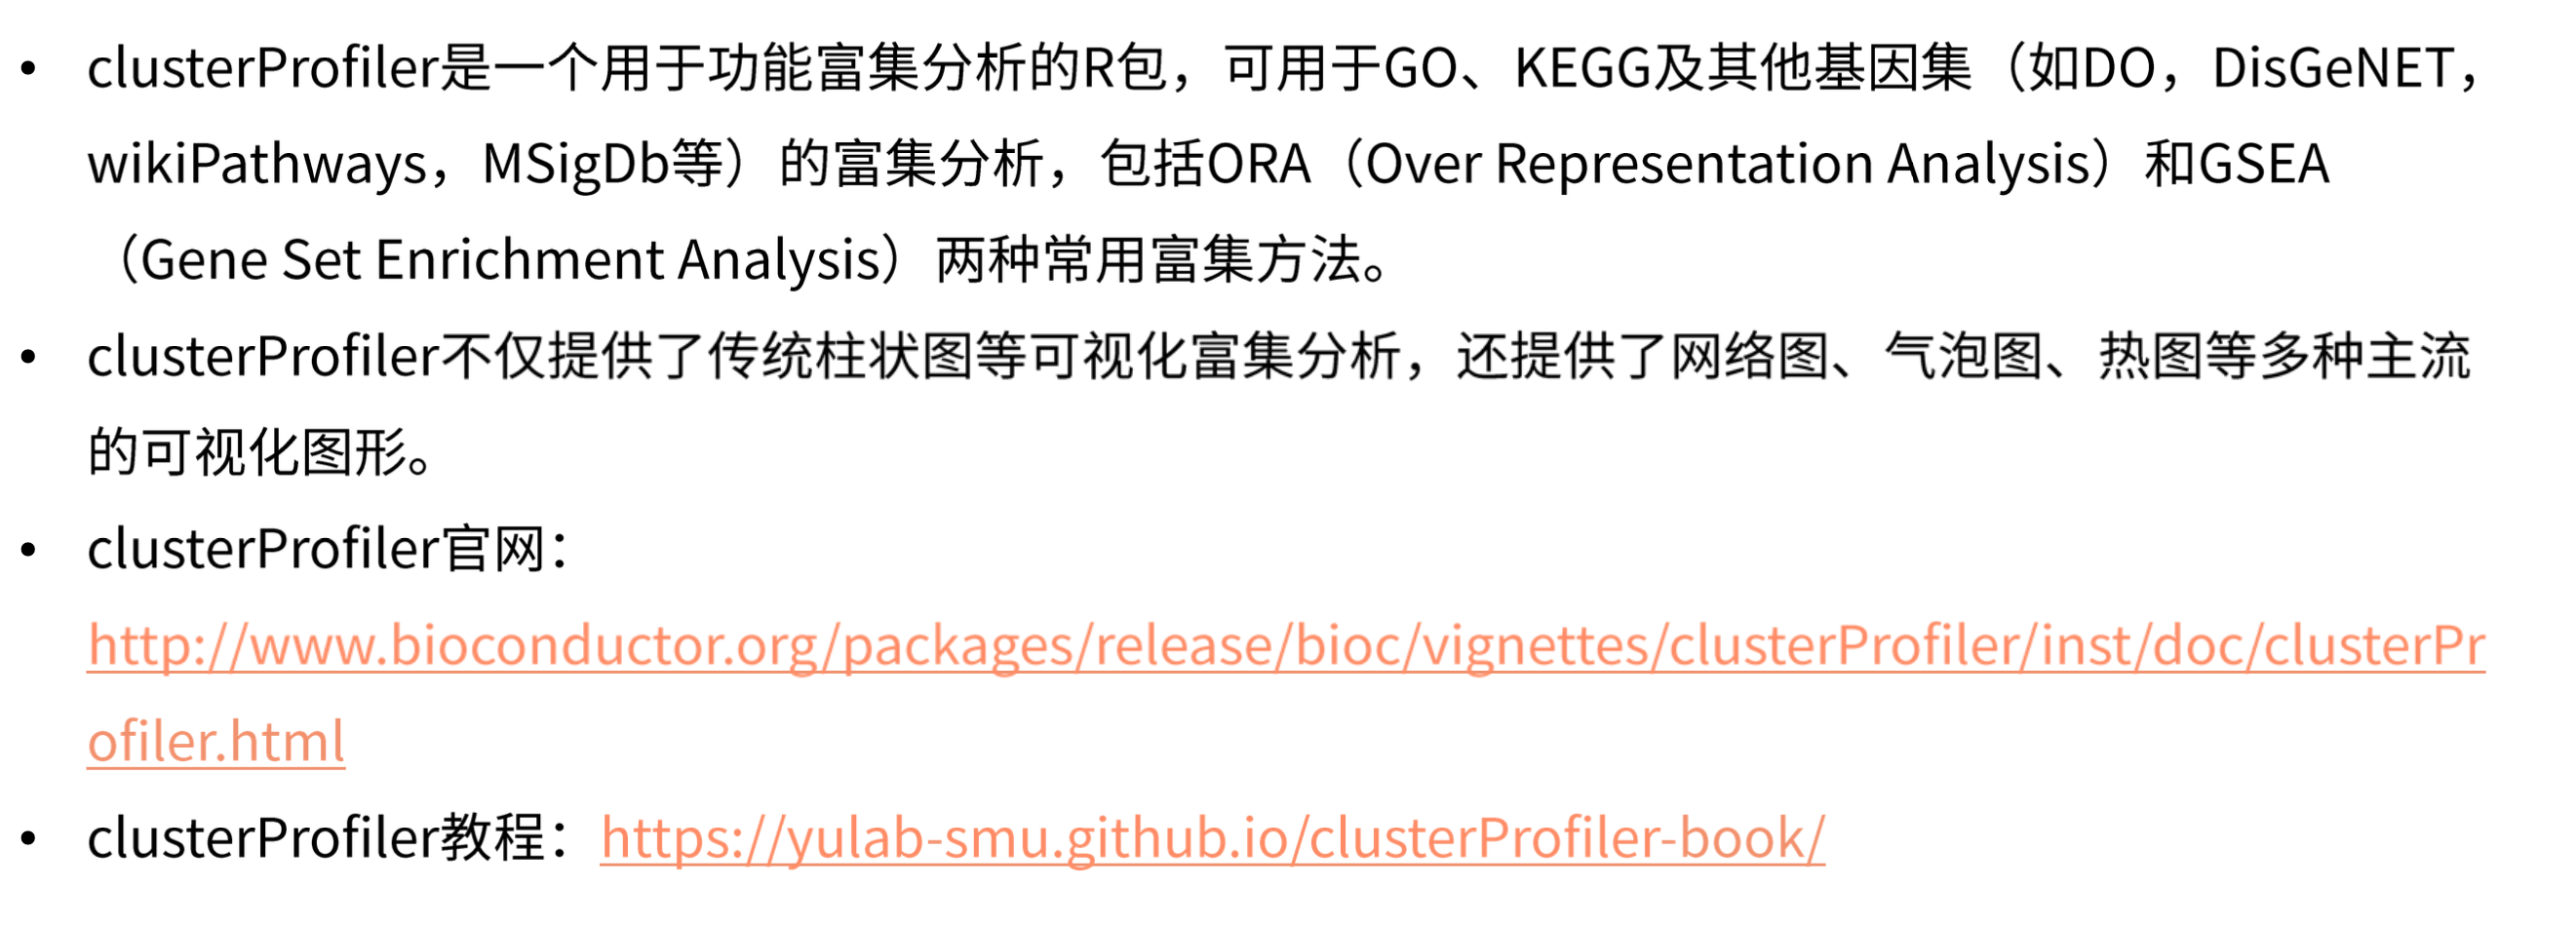
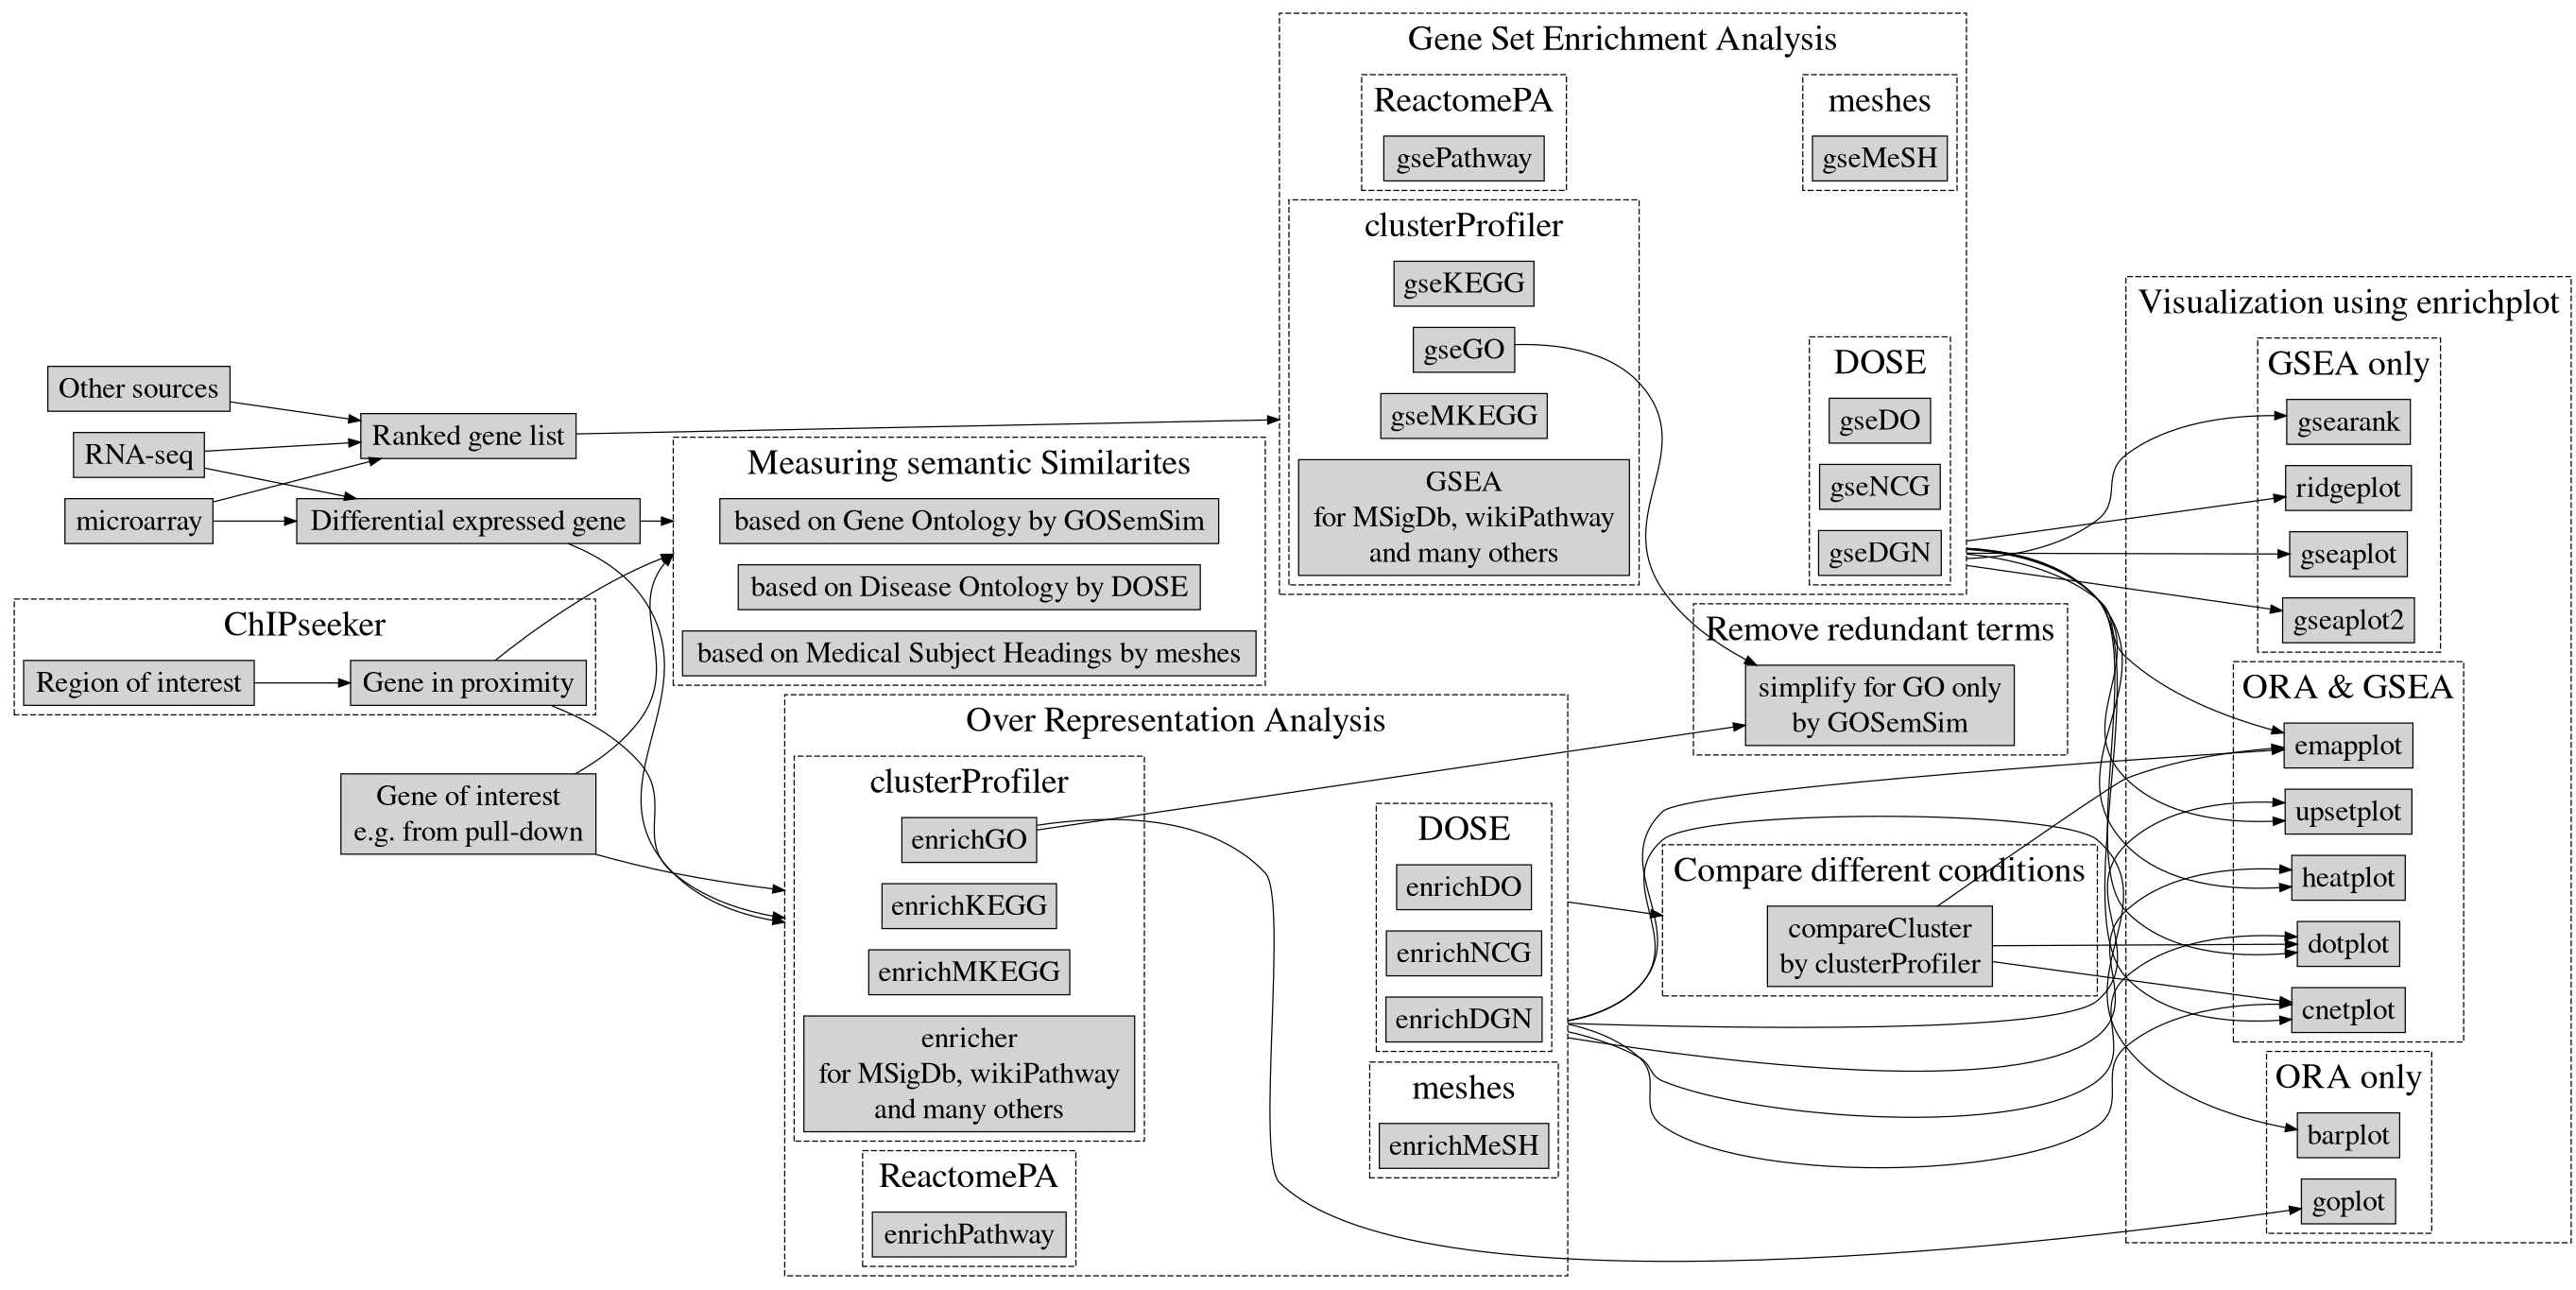
clusterProfiler包

clusterProfiler包
泡泡分析
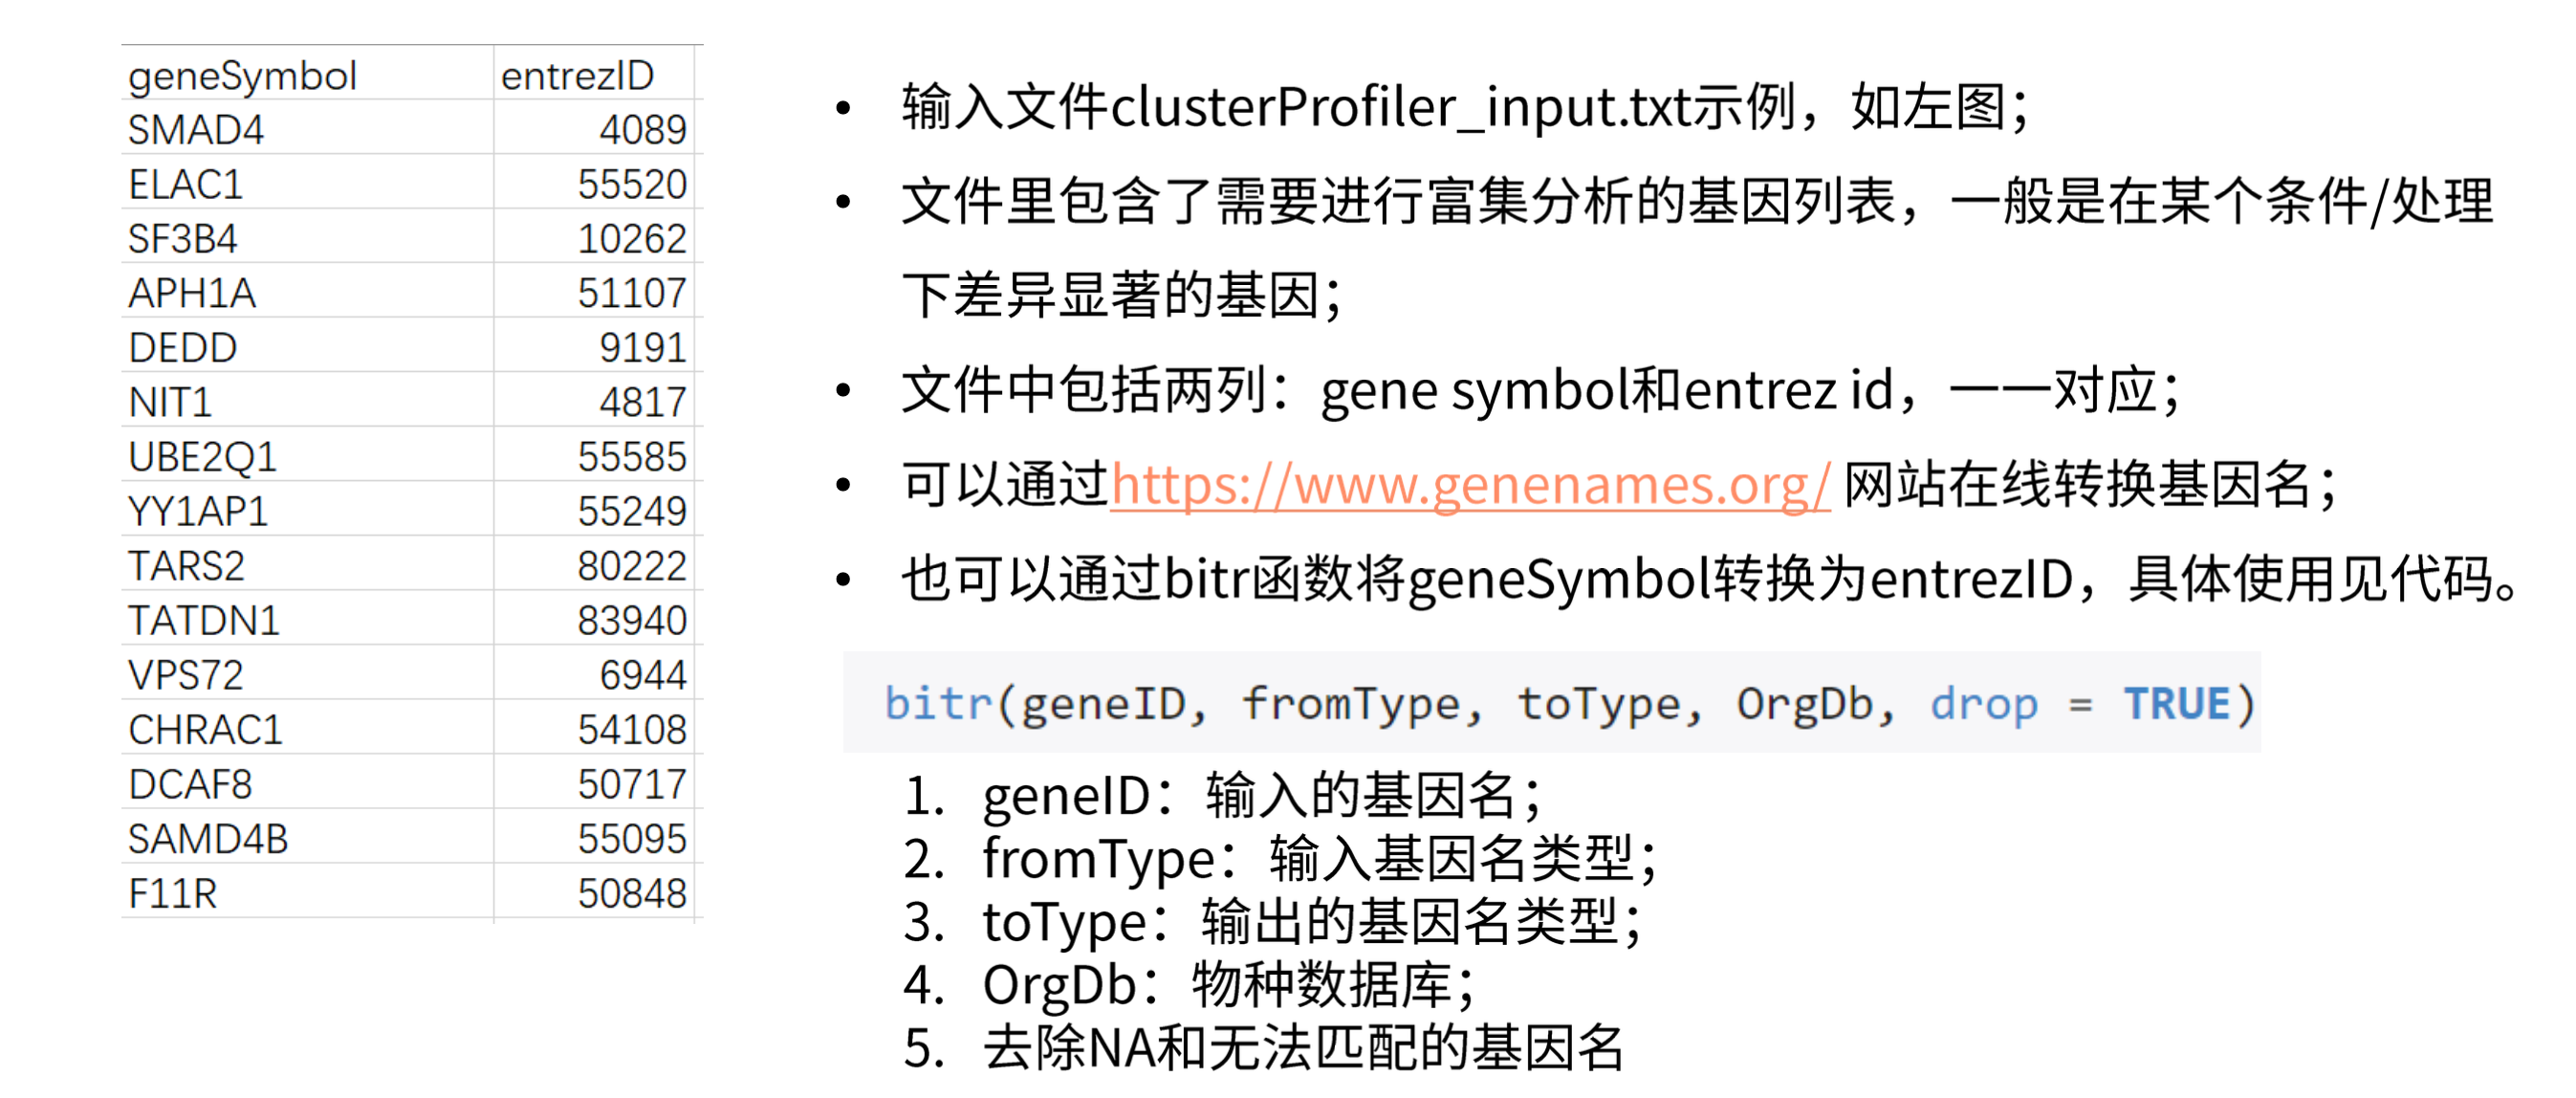
输入数据:富集分析基因列表
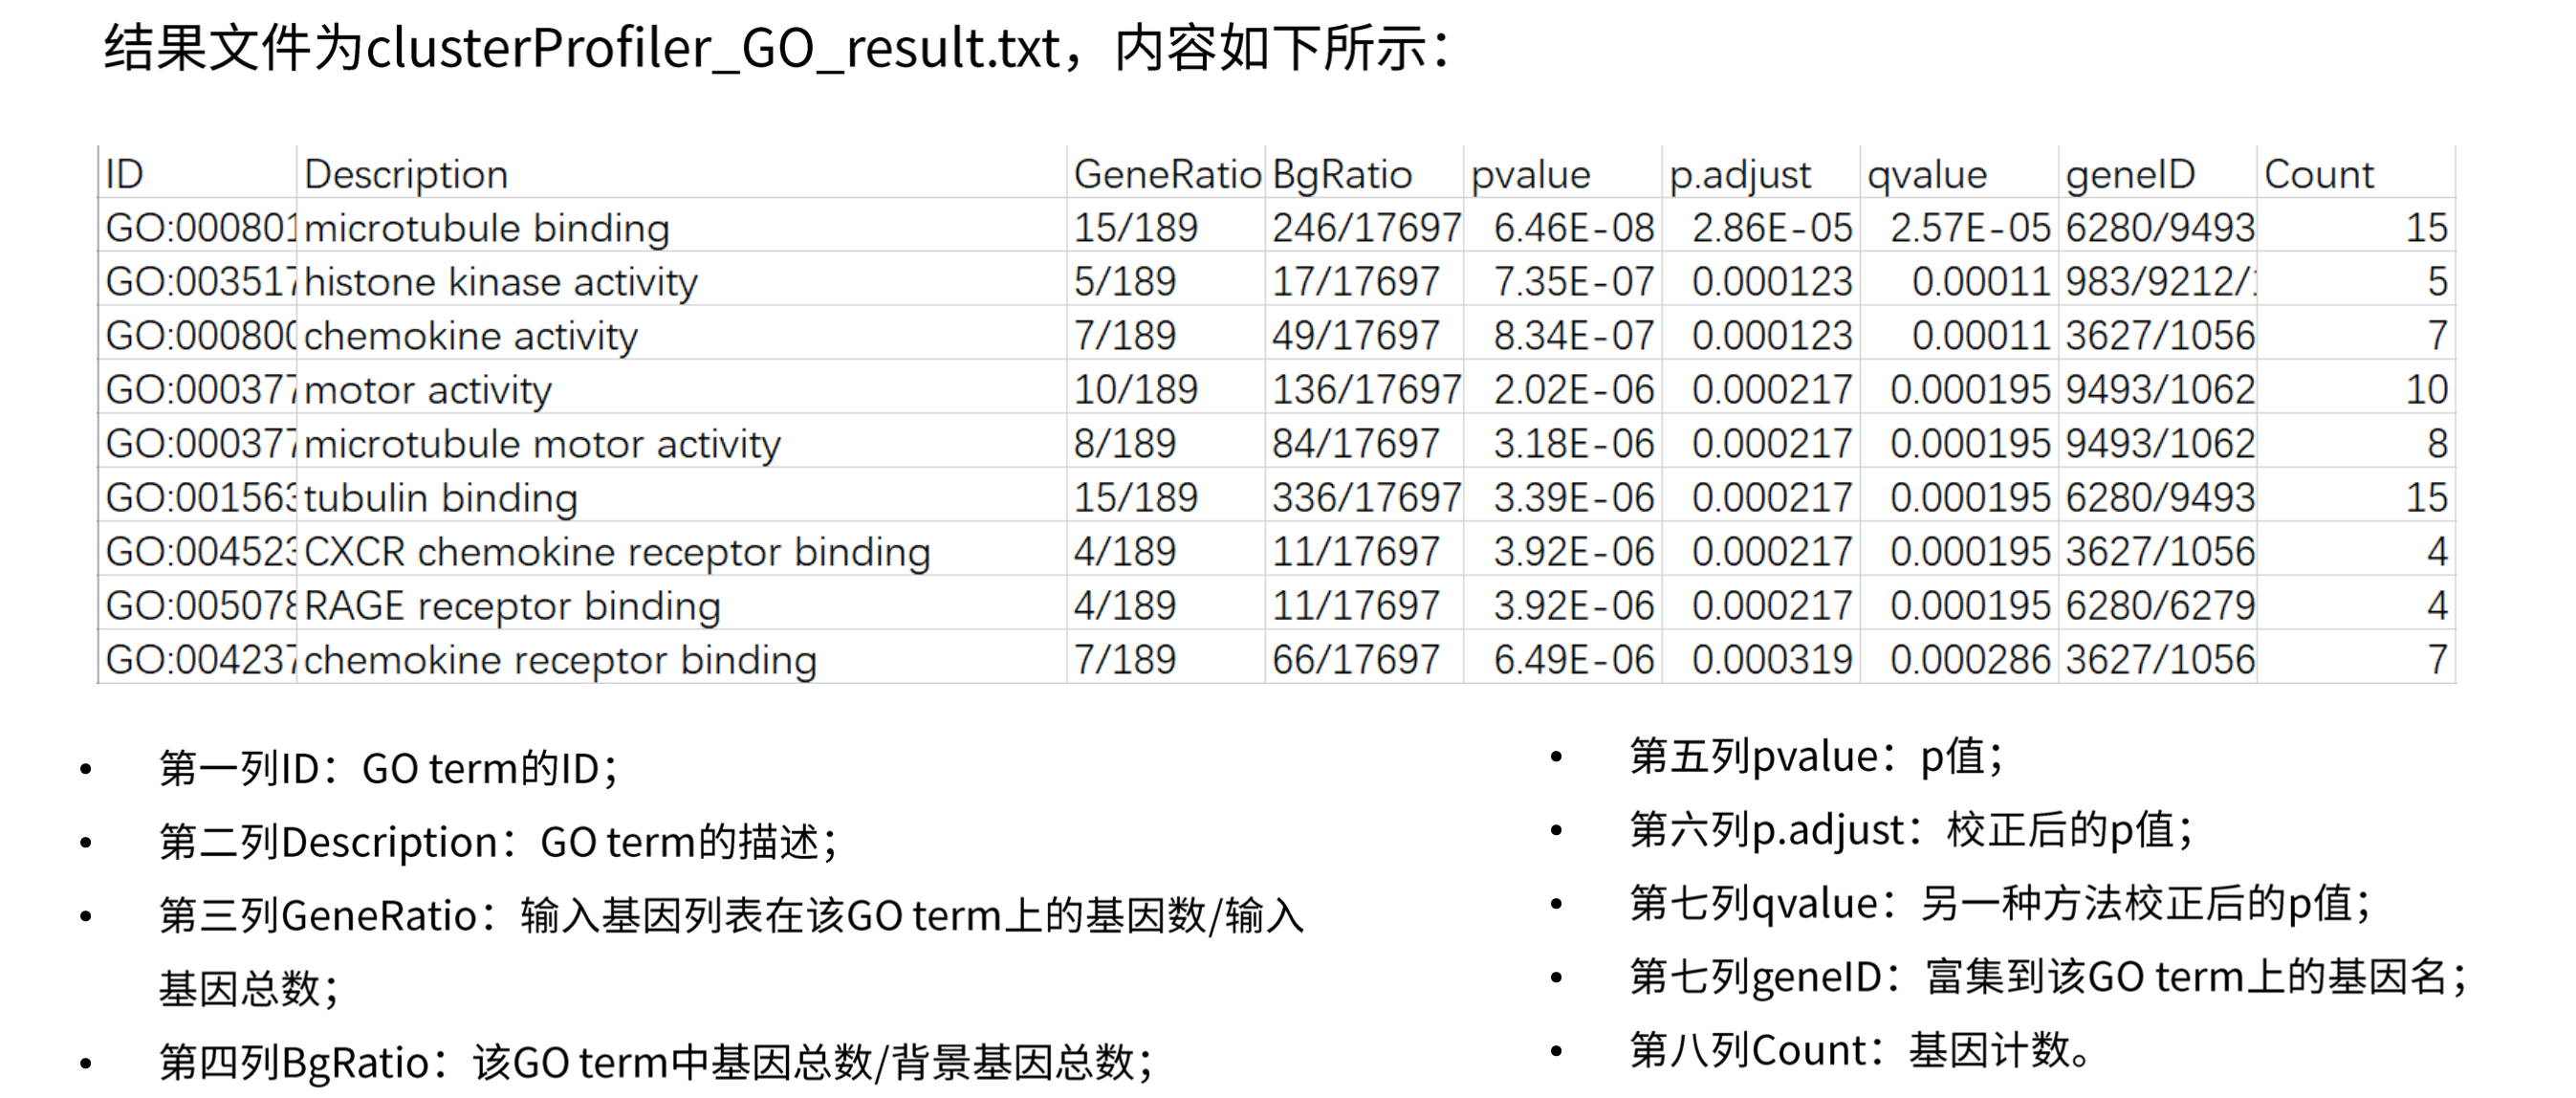
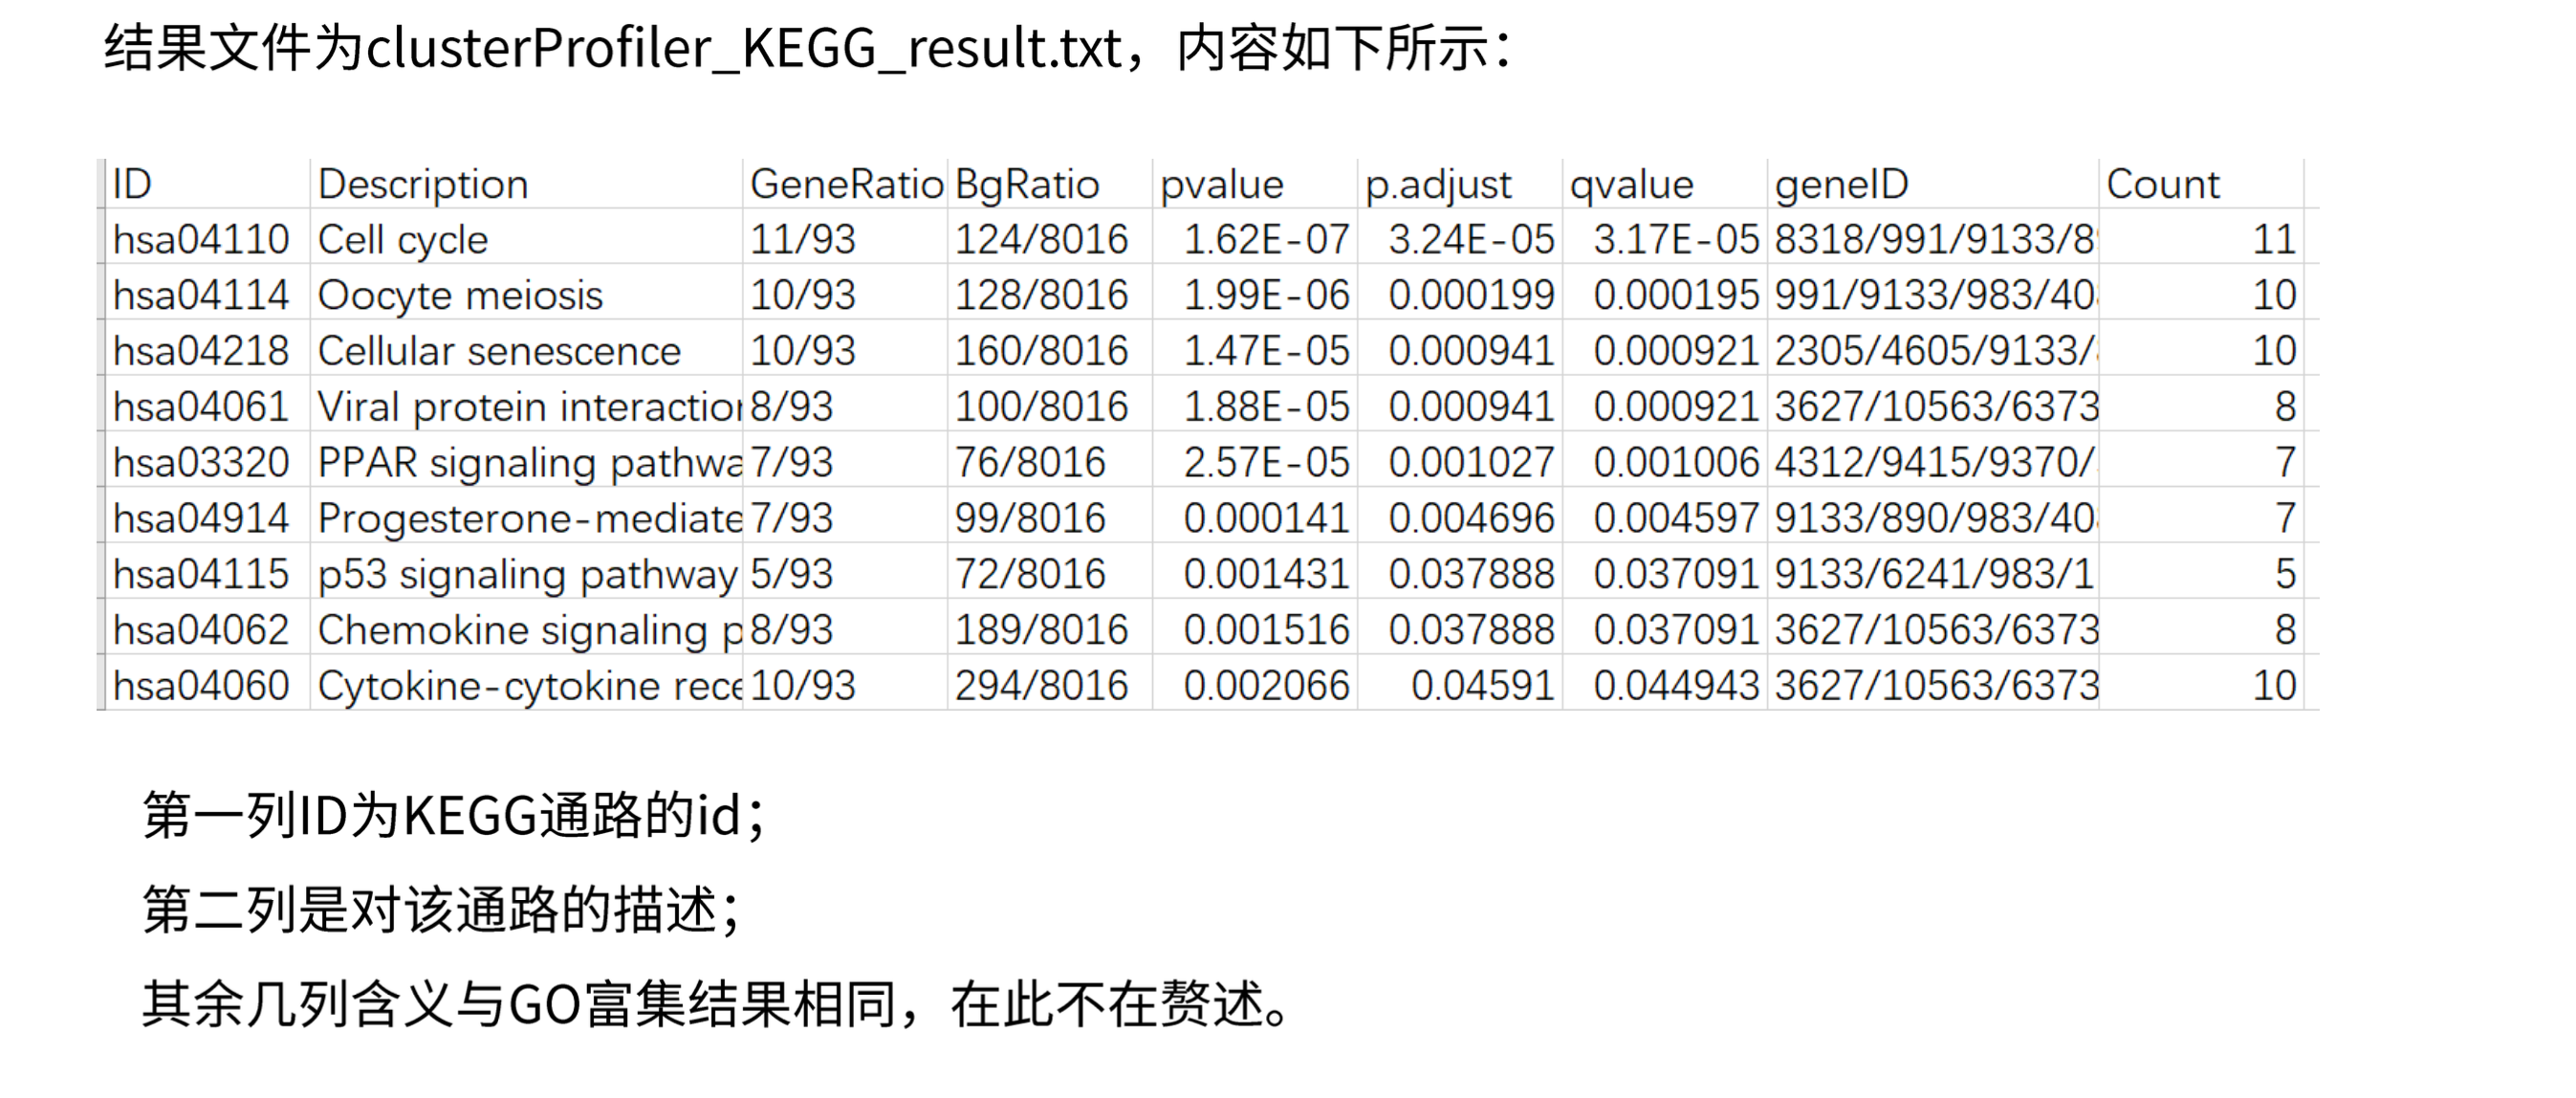
输出数据:富集结果
输出结果:go.RData1
2
3
4
5
6
7
8
9
10
11
12
13
14
15
16
17
18
19
20
21
22
23
24
25
26
27
28
29
30
31
32
33
34
35
36
37
38
39
40
41
42
43
44# load packages -----------------------------------------------------------
library(clusterProfiler)
library(org.Bt.eg.db)
library(readxl)
# load data ---------------------------------------------------------------
rna <- read_xlsx("gene.xlsx")
SYMBOL <- unique(rna$geneSymbol)
rna <- data.frame(SYMBOL)
# Id transition -----------------------------------------------------------
gene.list <- bitr(rna$SYMBOL,
fromType = "SYMBOL",
toType = "ENTREZID",
OrgDb = org.Bt.eg.db)
head(gene.list)
# prepare analysis --------------------------------------------------------
gene <- gene.list$ENTREZID
# GO analysis -------------------------------------------------------------
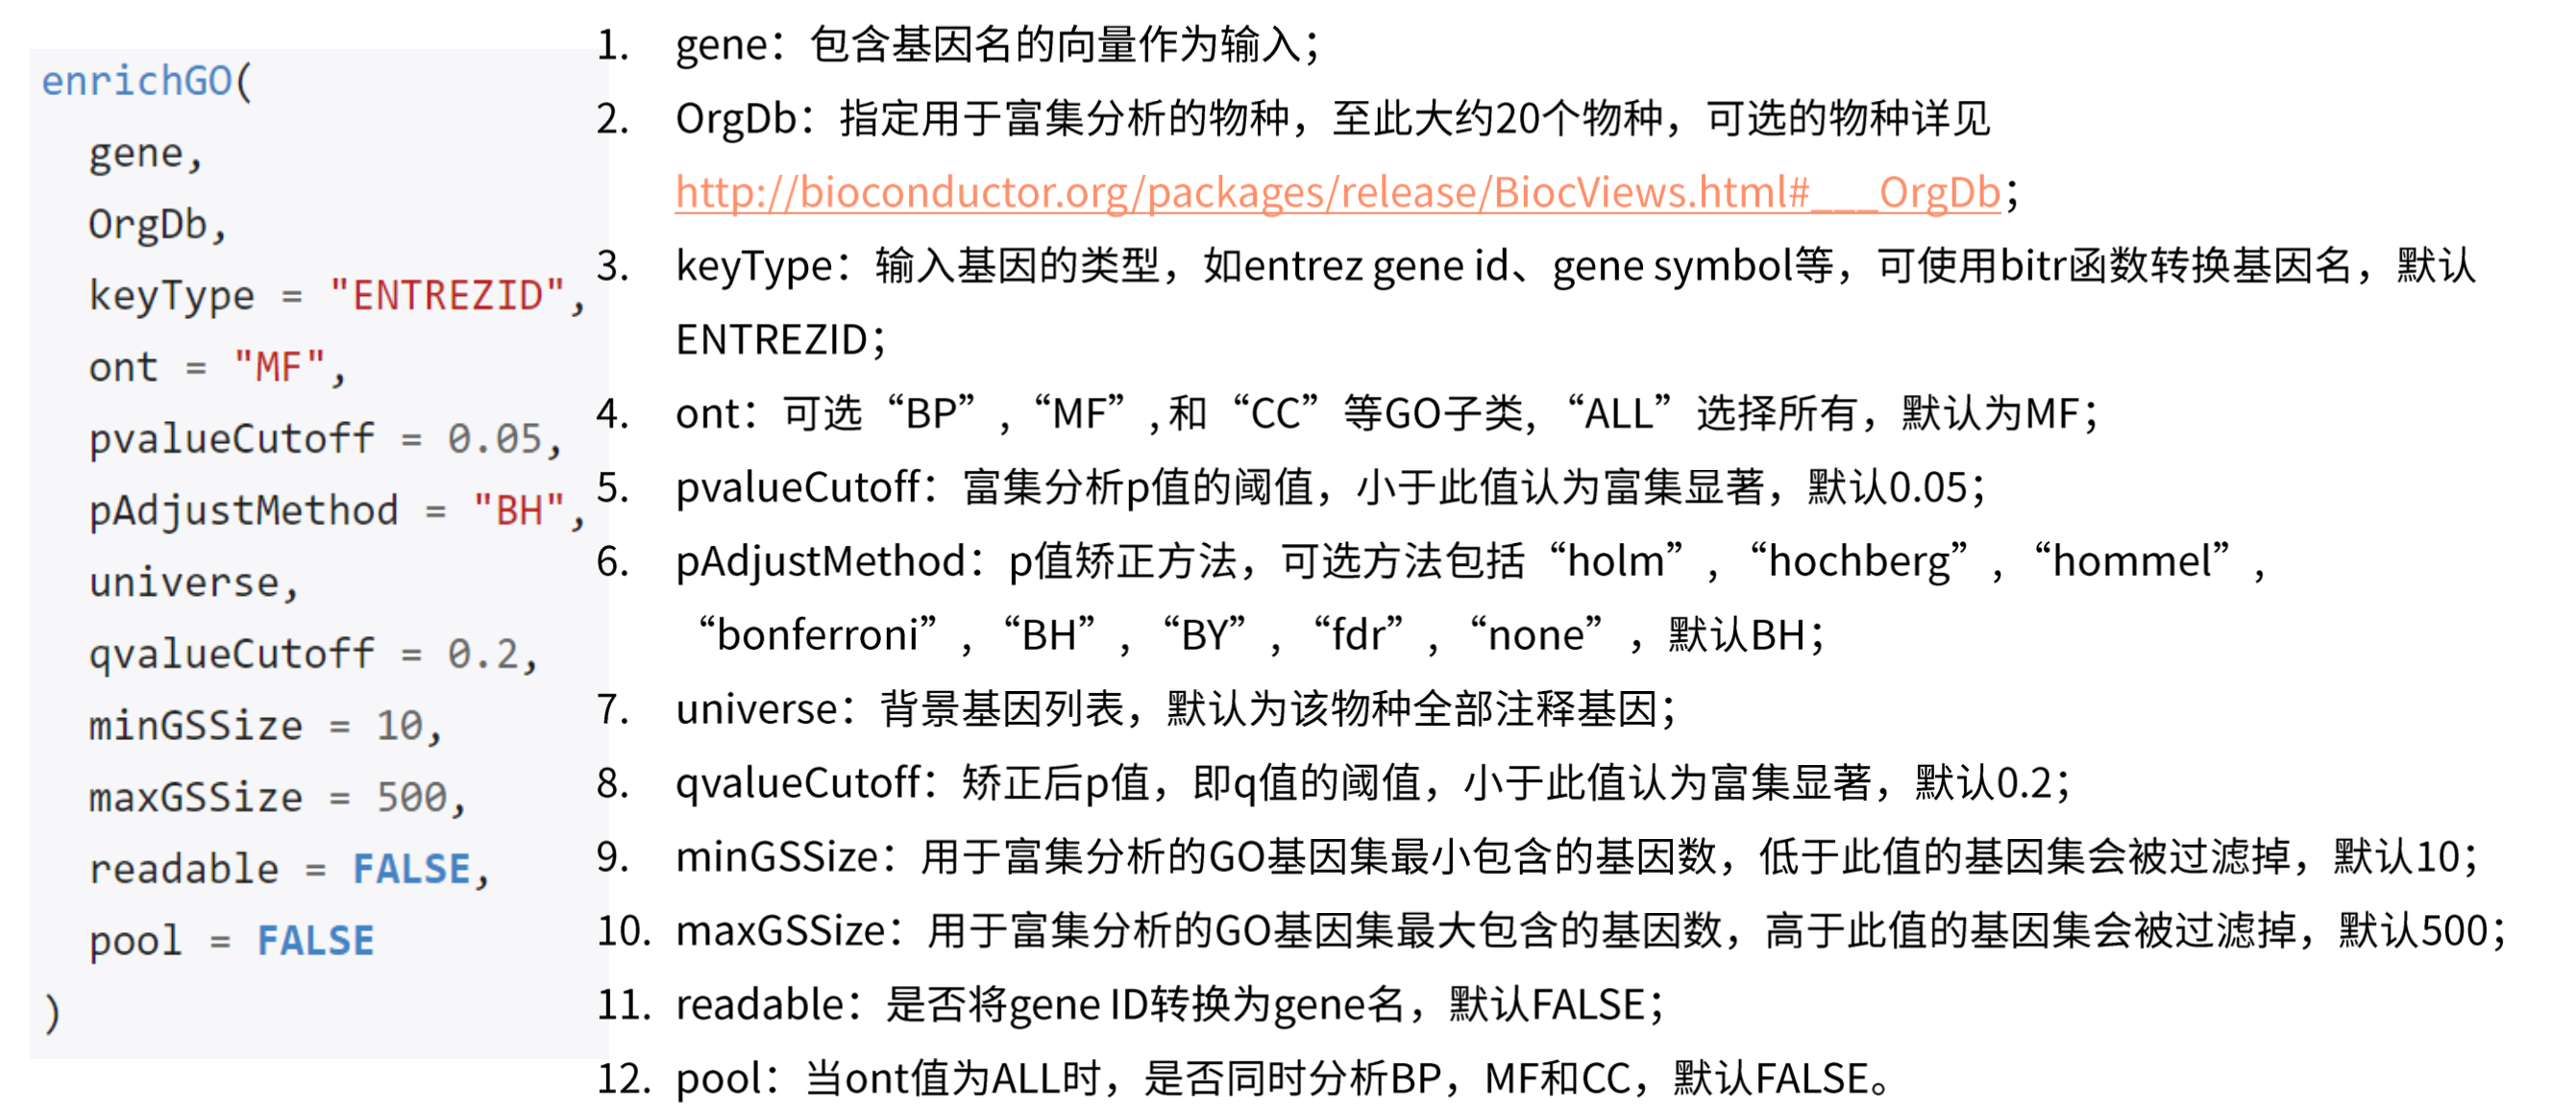
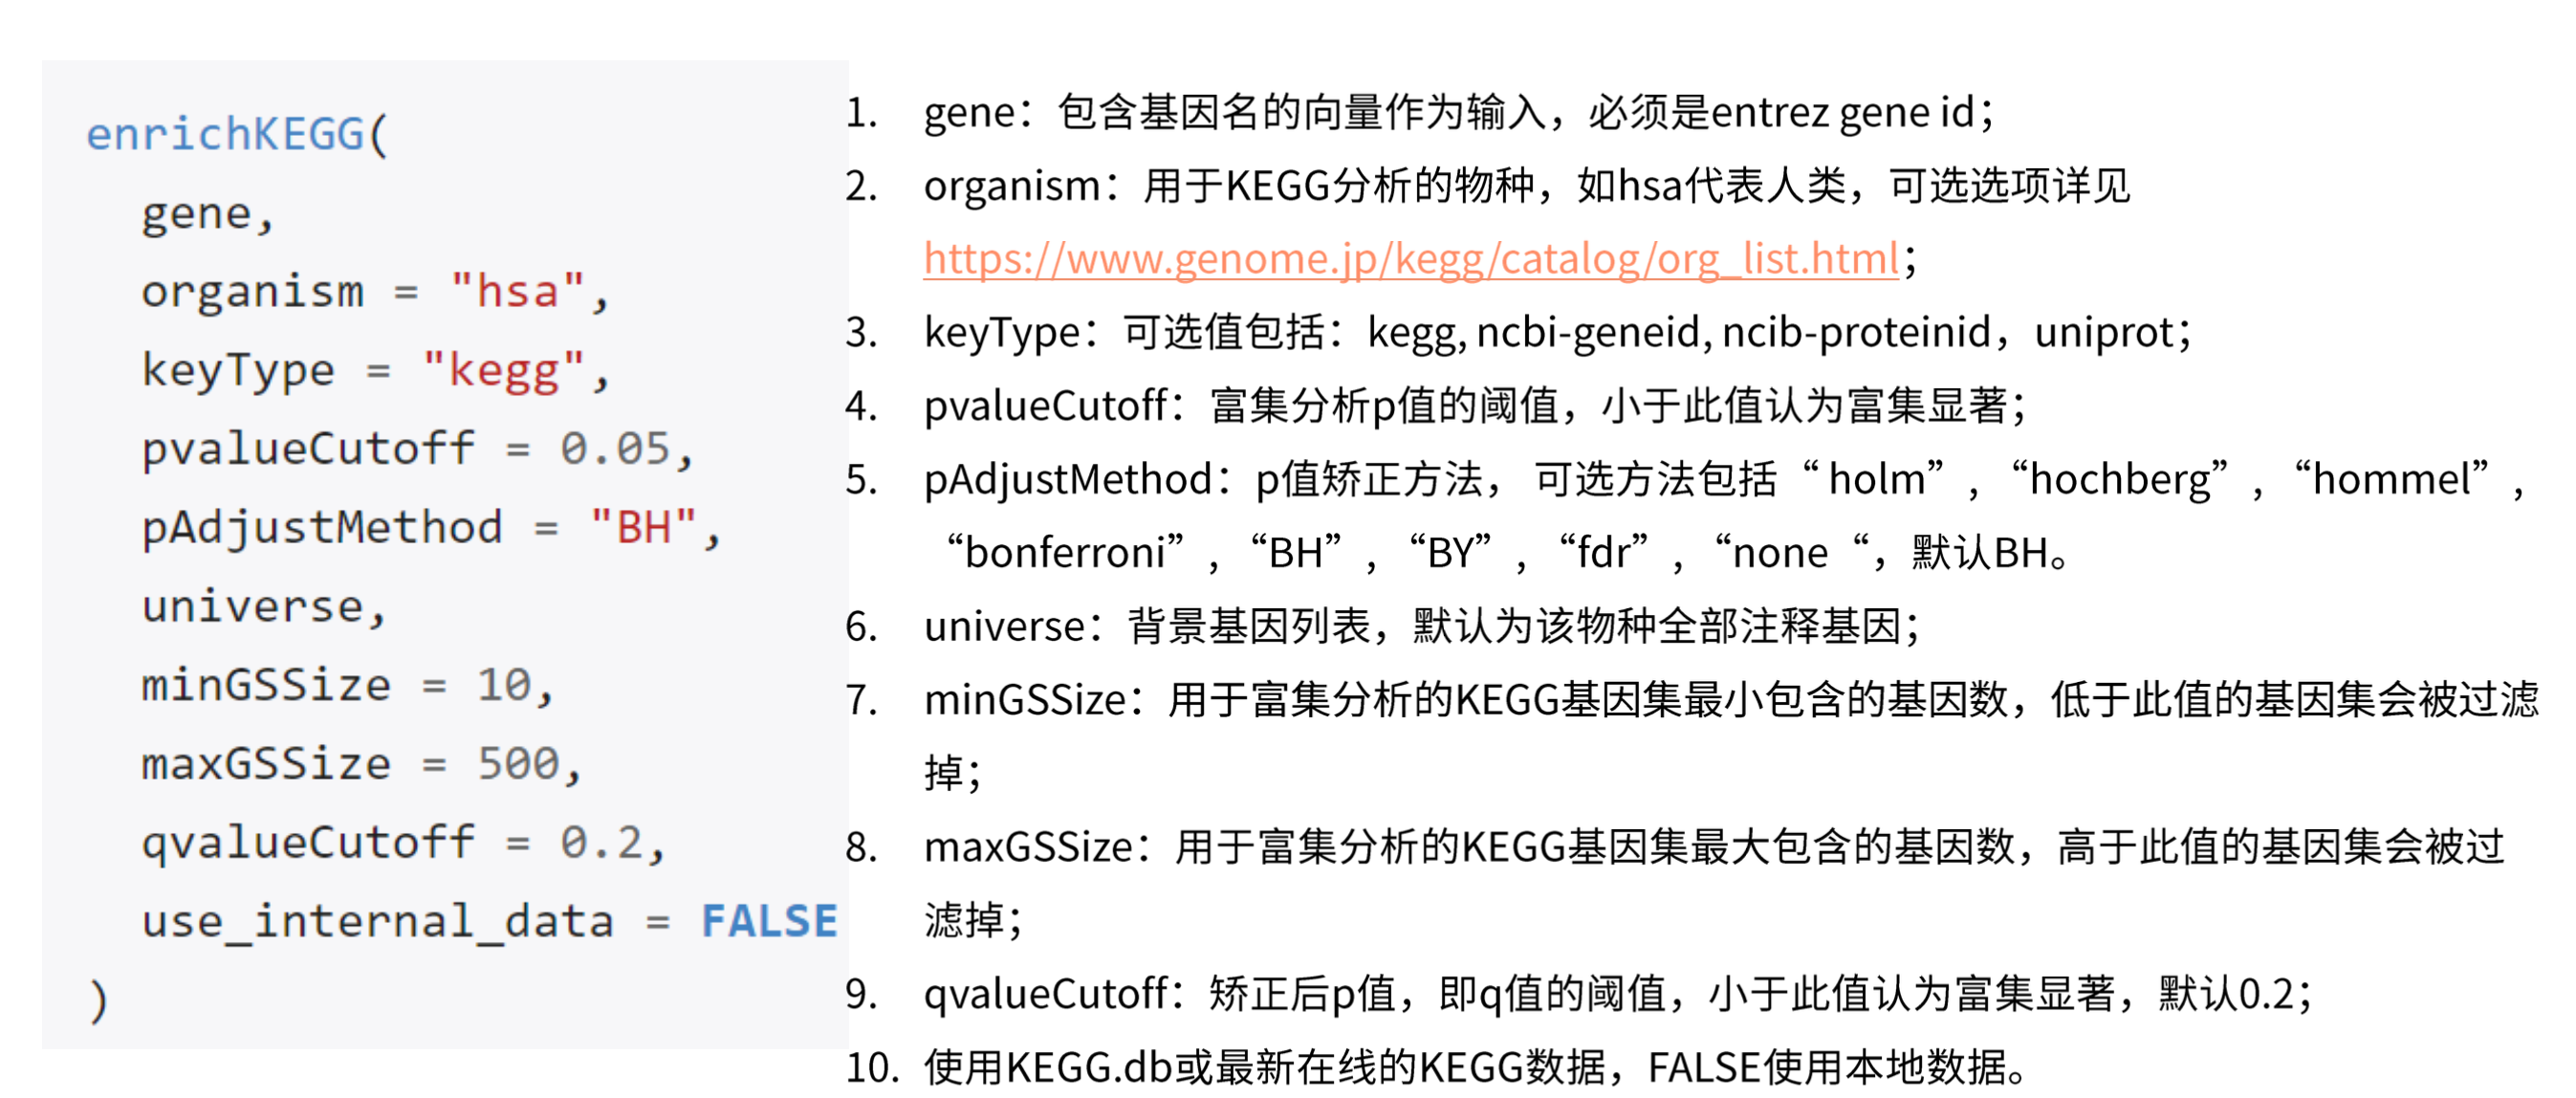
go <- enrichGO(gene = gene,
OrgDb = org.Bt.eg.db,
keyType = "ENTREZID",
ont = 'ALL',
pvalueCutoff = 0.05,
pAdjustMethod = 'BH',
qvalueCutoff = 0.05,
minGSSize = 10,
maxGSSize = 500,
readable = T,
pool = F)
# Output the result -------------------------------------------------------
write.csv(go@result, file = "go_enrichresults.csv")
save(go, file = "go.RData")
1 | # kegg analysis ----------------------------------------------------------- |
可视化
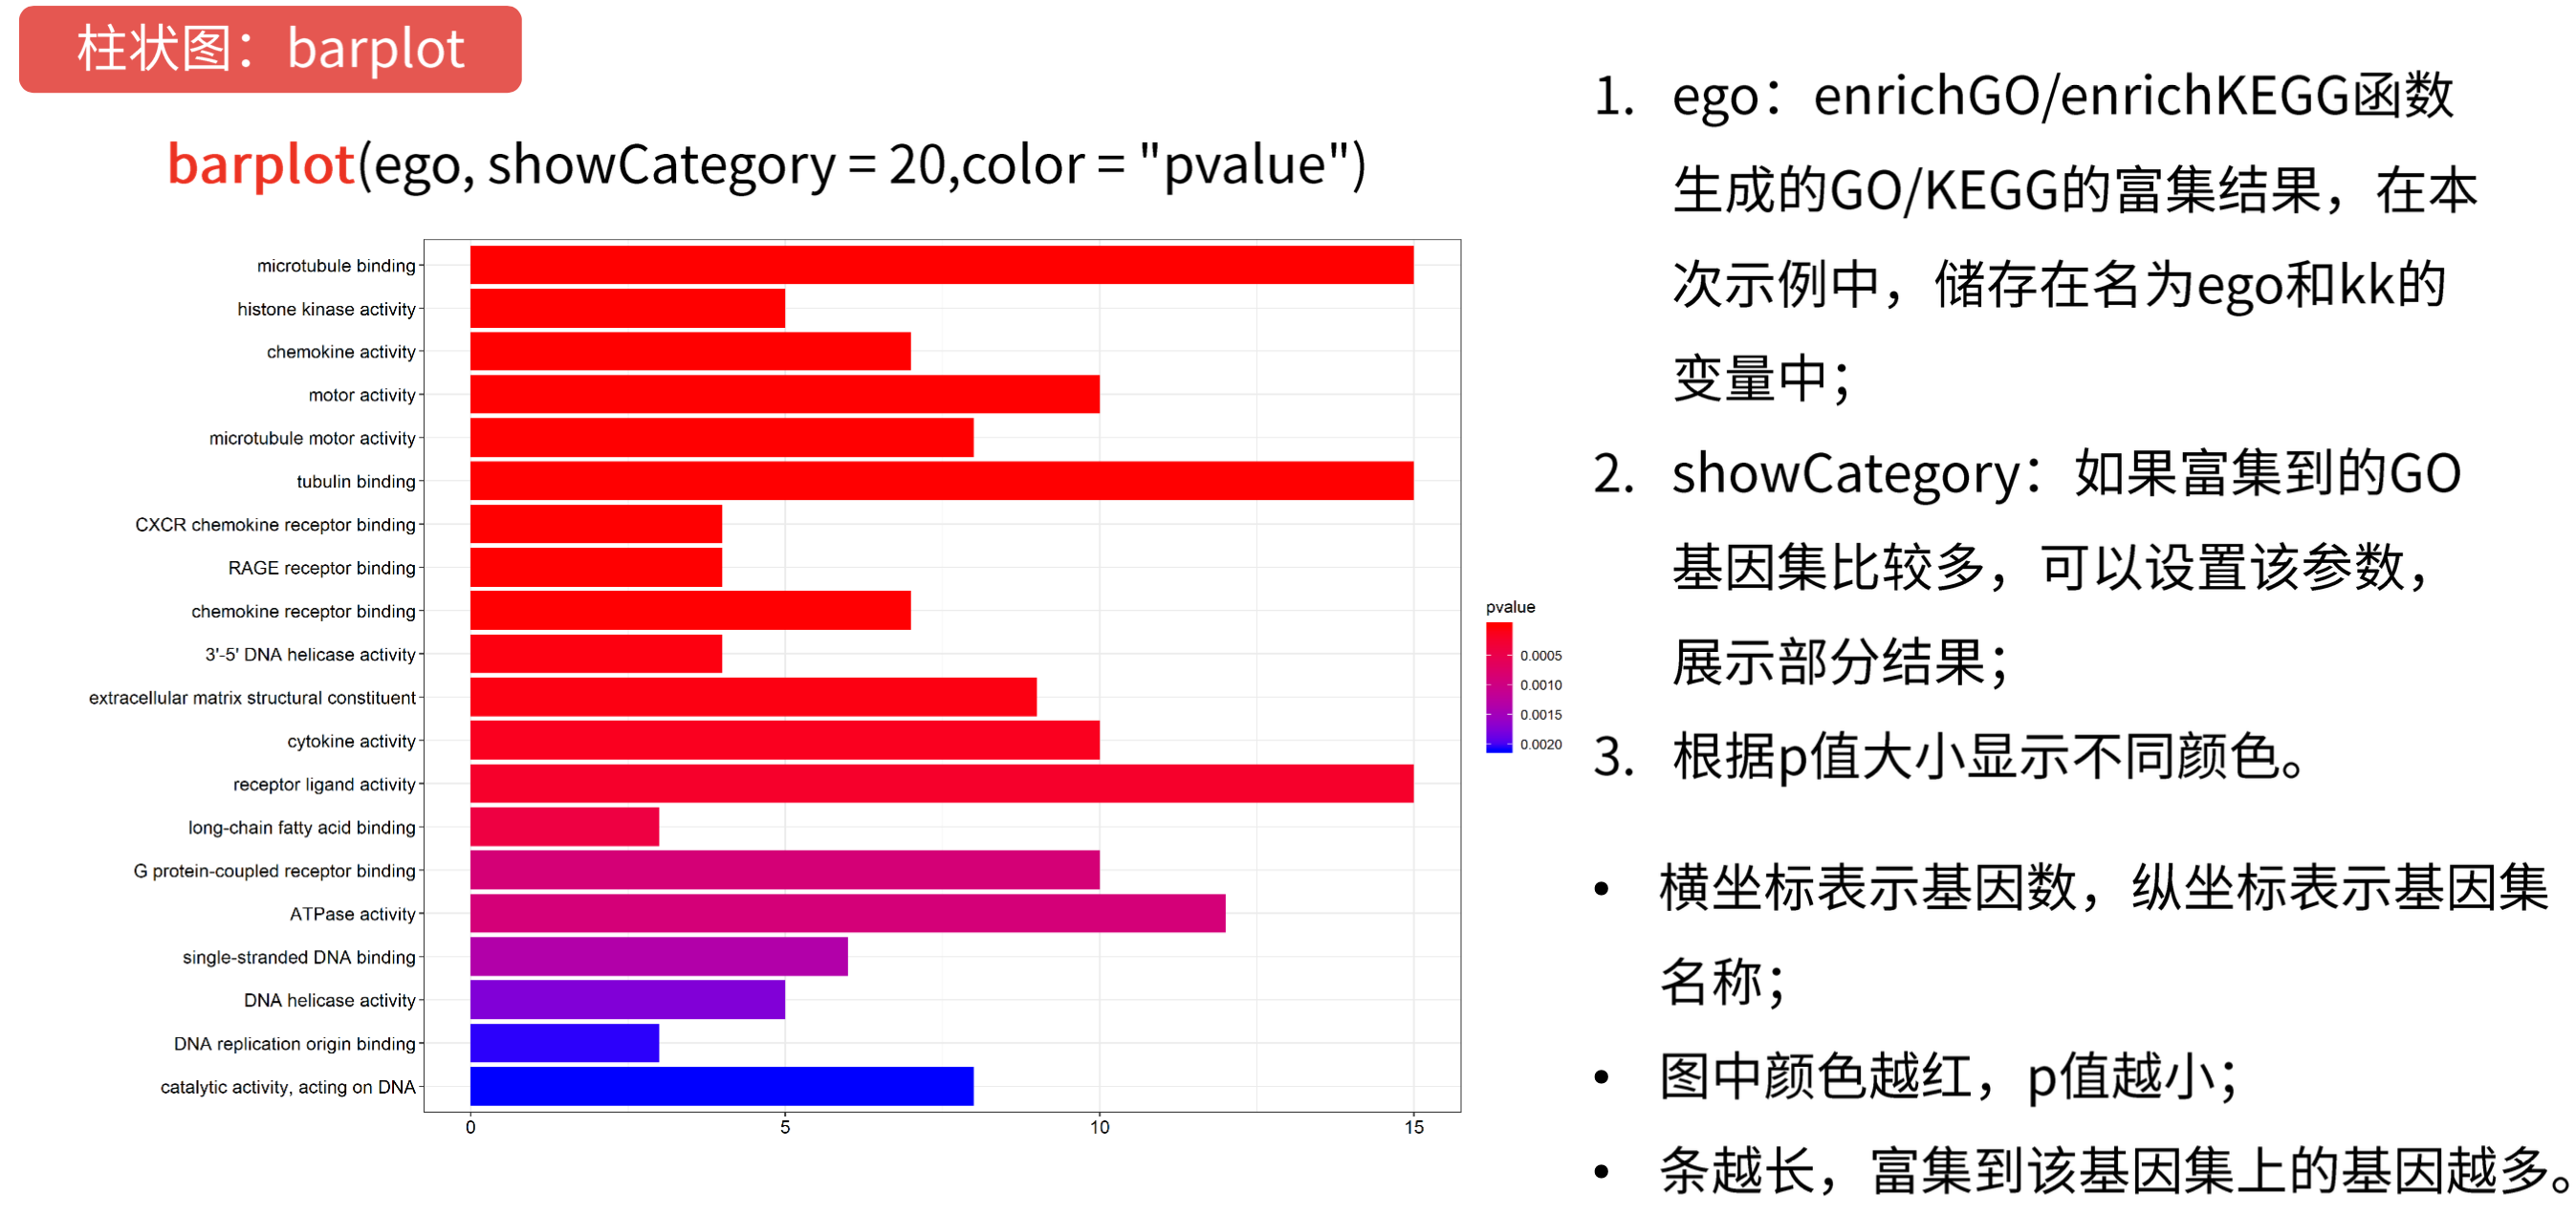
1 | barplot(go, showCategory = 20, color = "pvalue") |
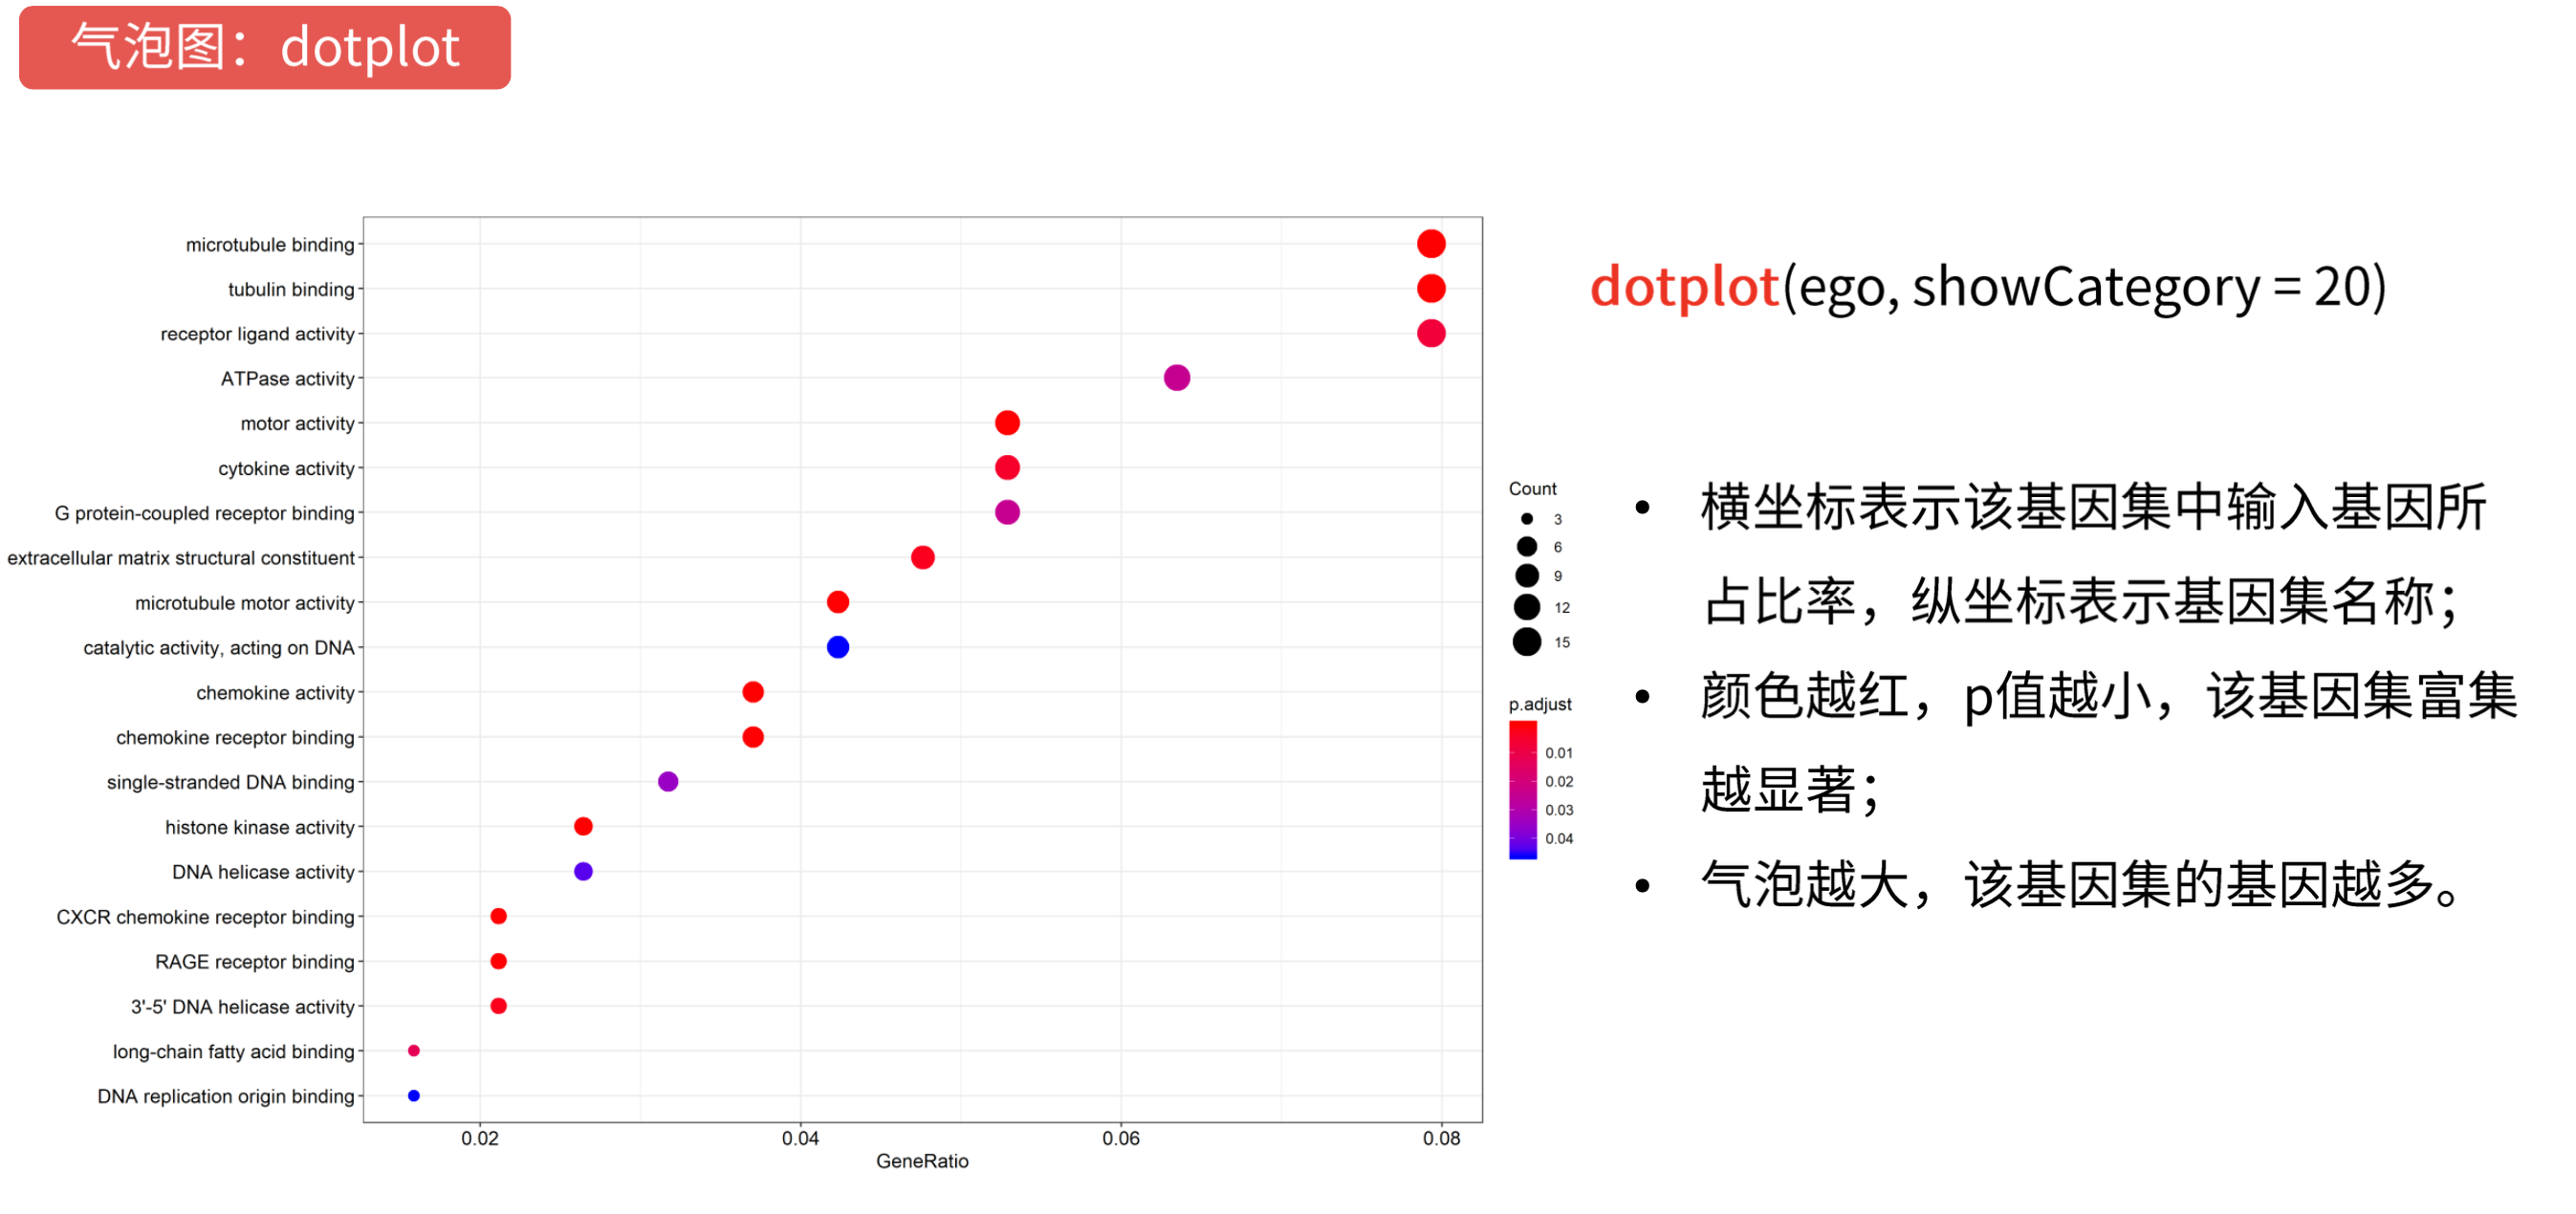
1 | dotplot(go, showCategory =20, color = "pvalue") |
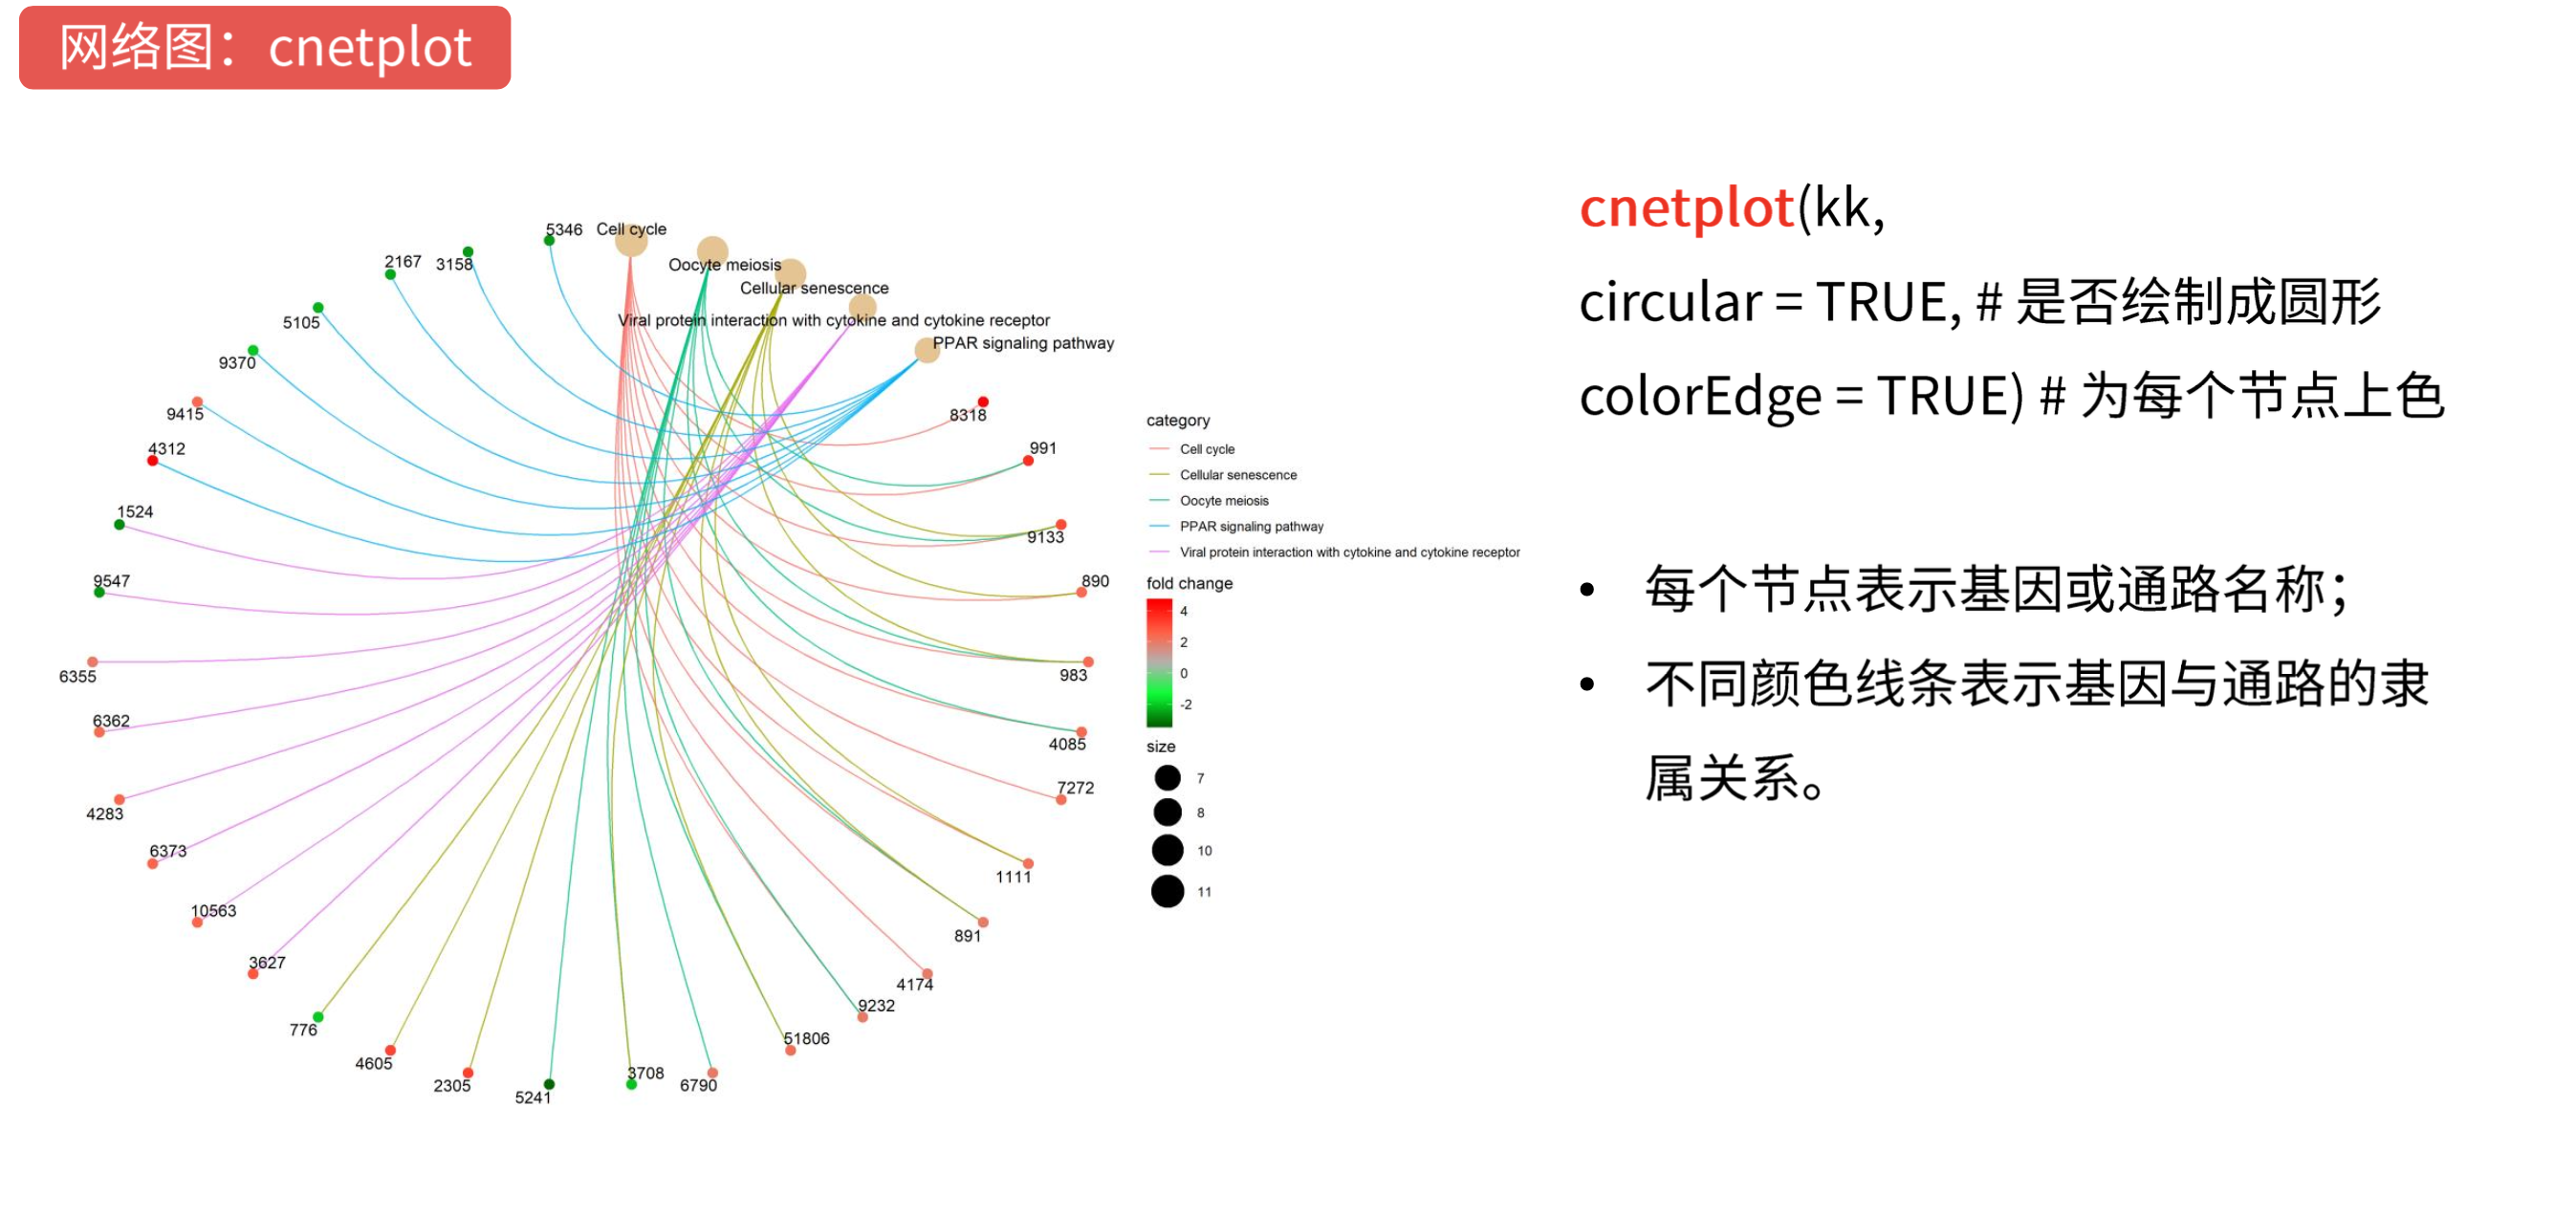
1 | cnetplot(kegg, circular = T, colorEdge = T) |
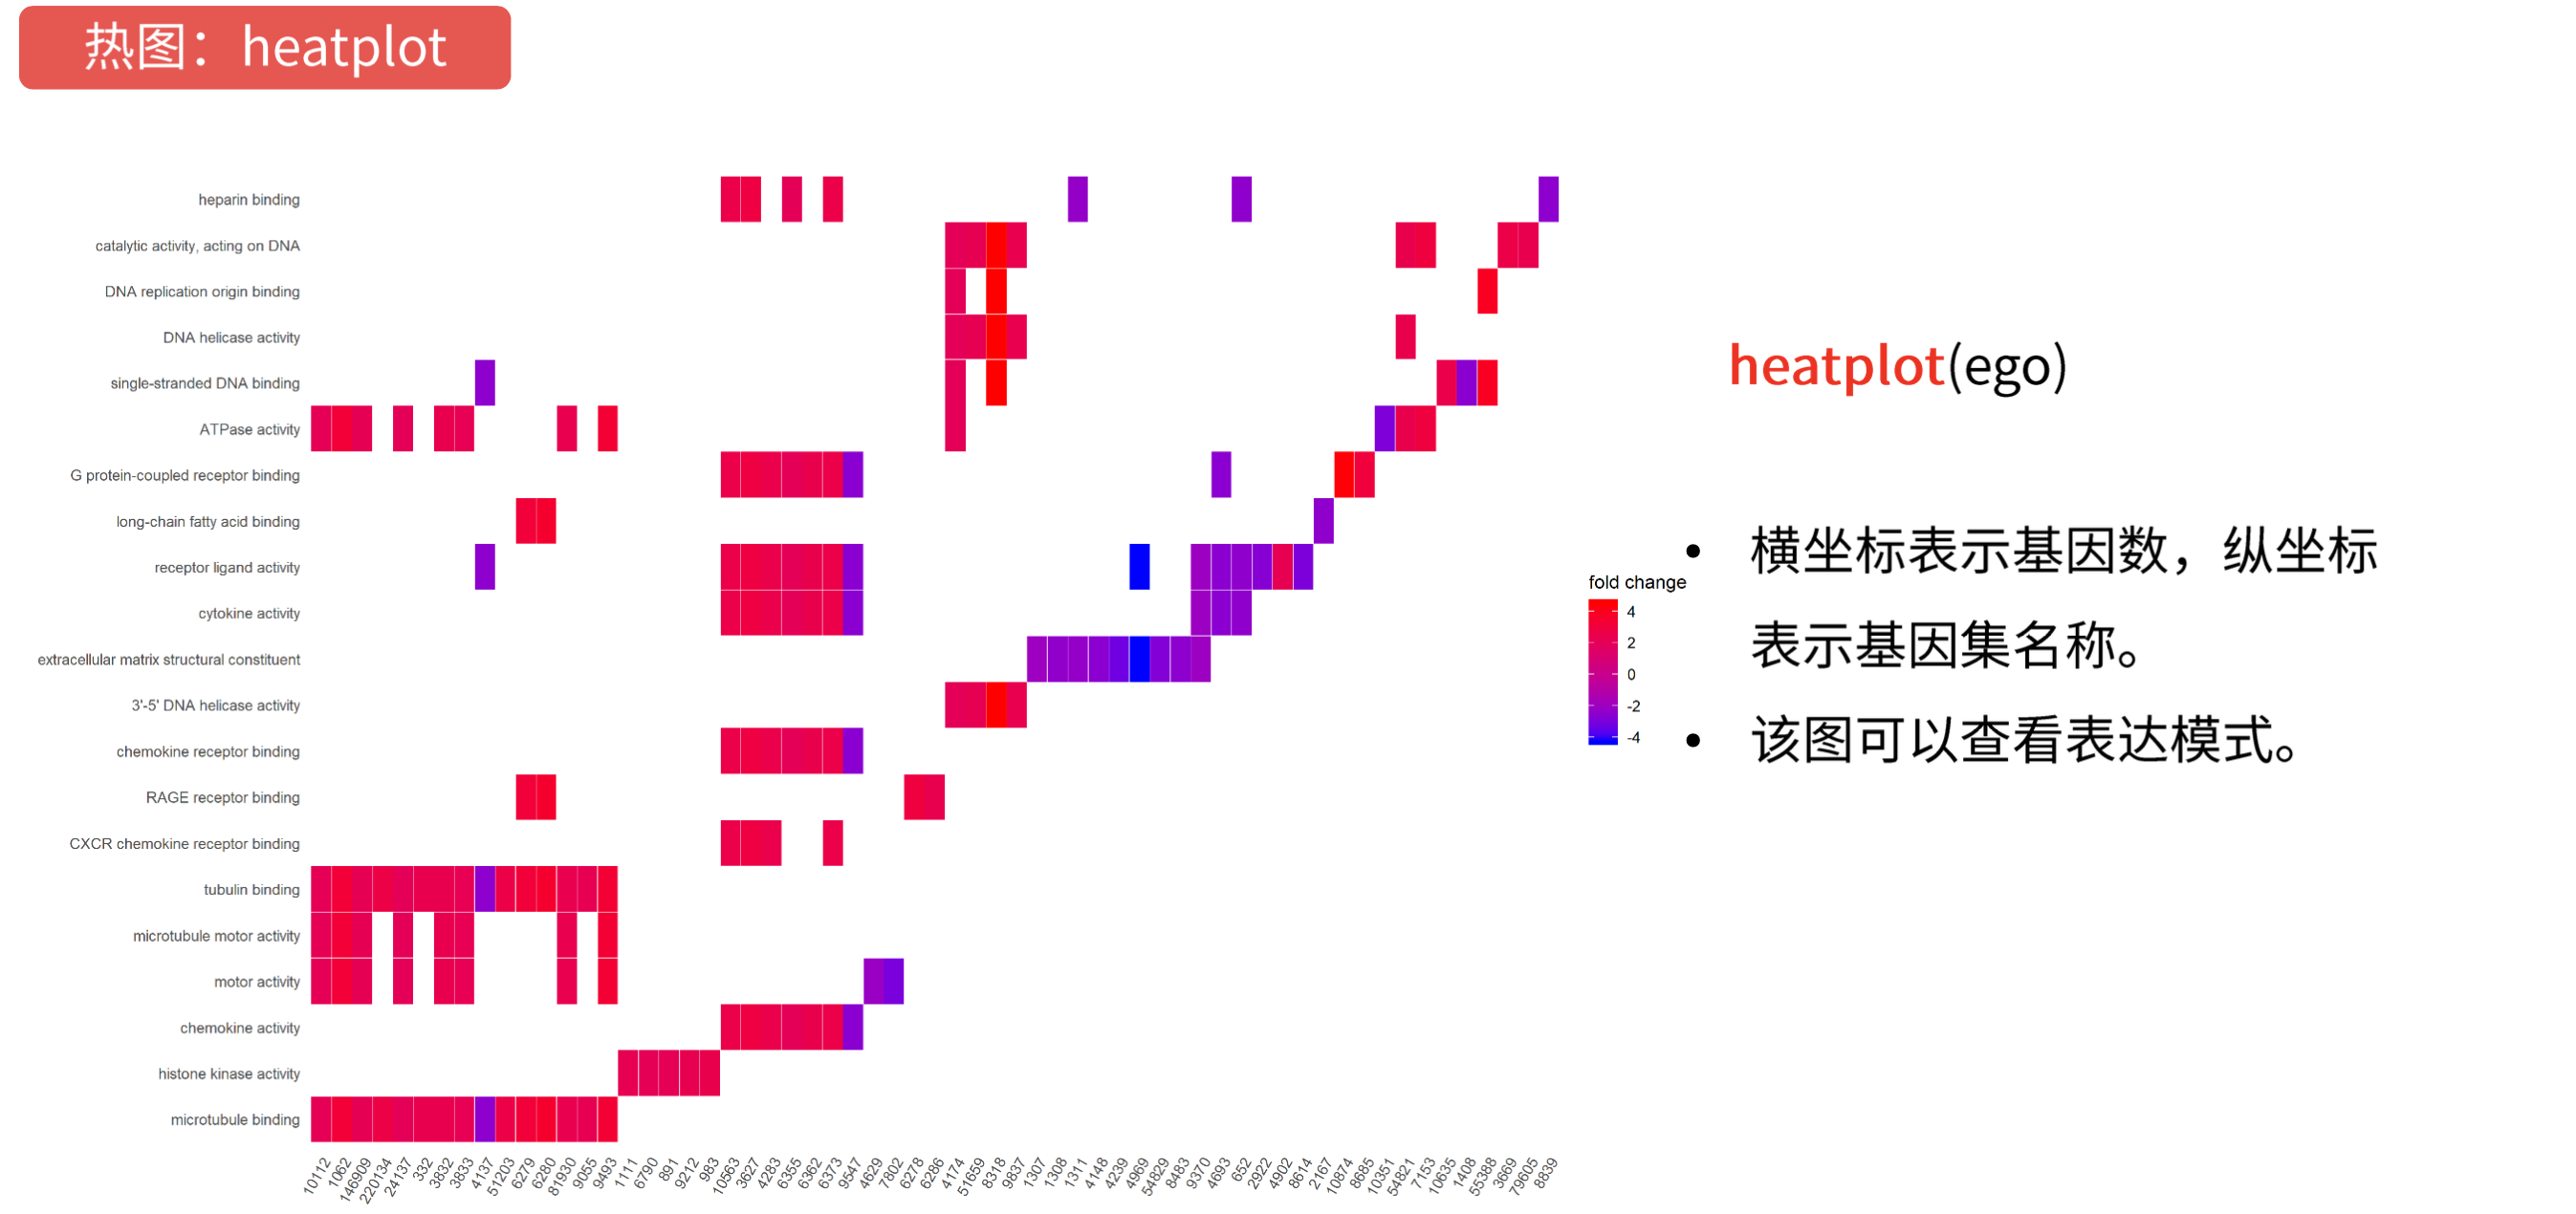
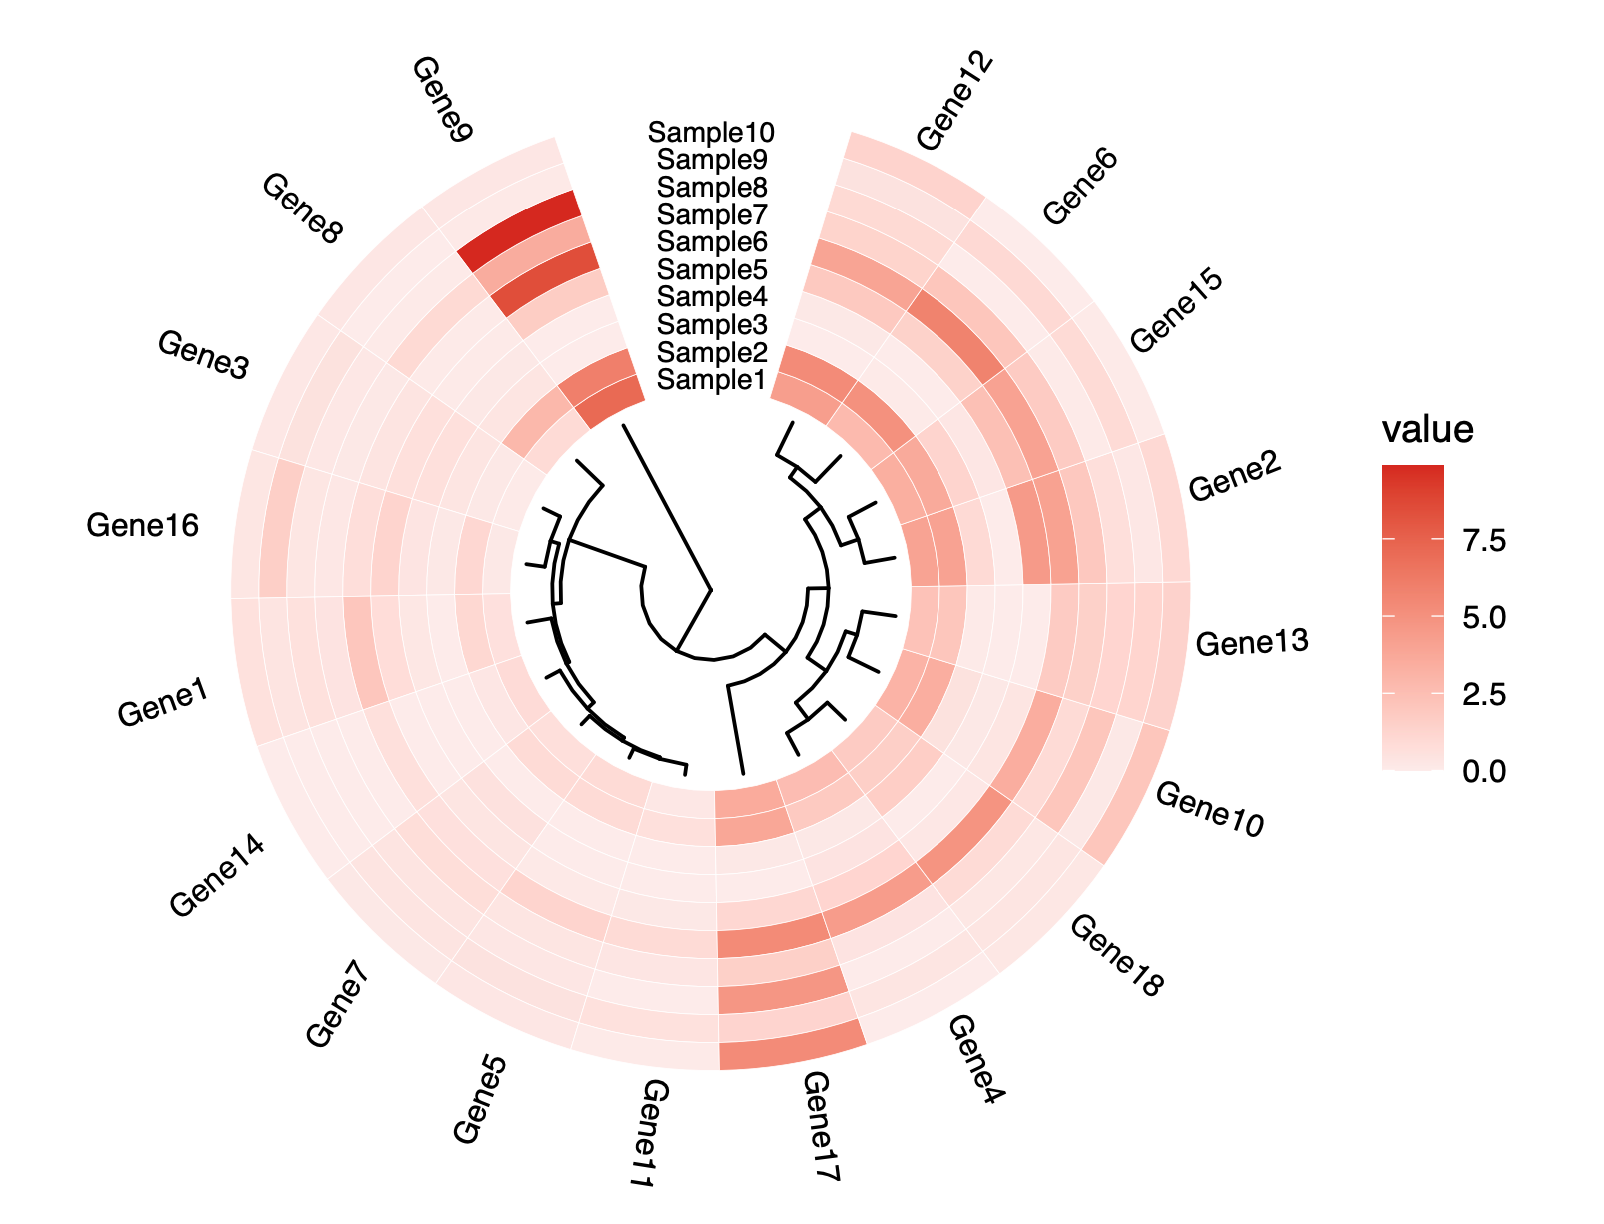
1 | heatplot(go) # 可添加差异倍数,增加色彩 |
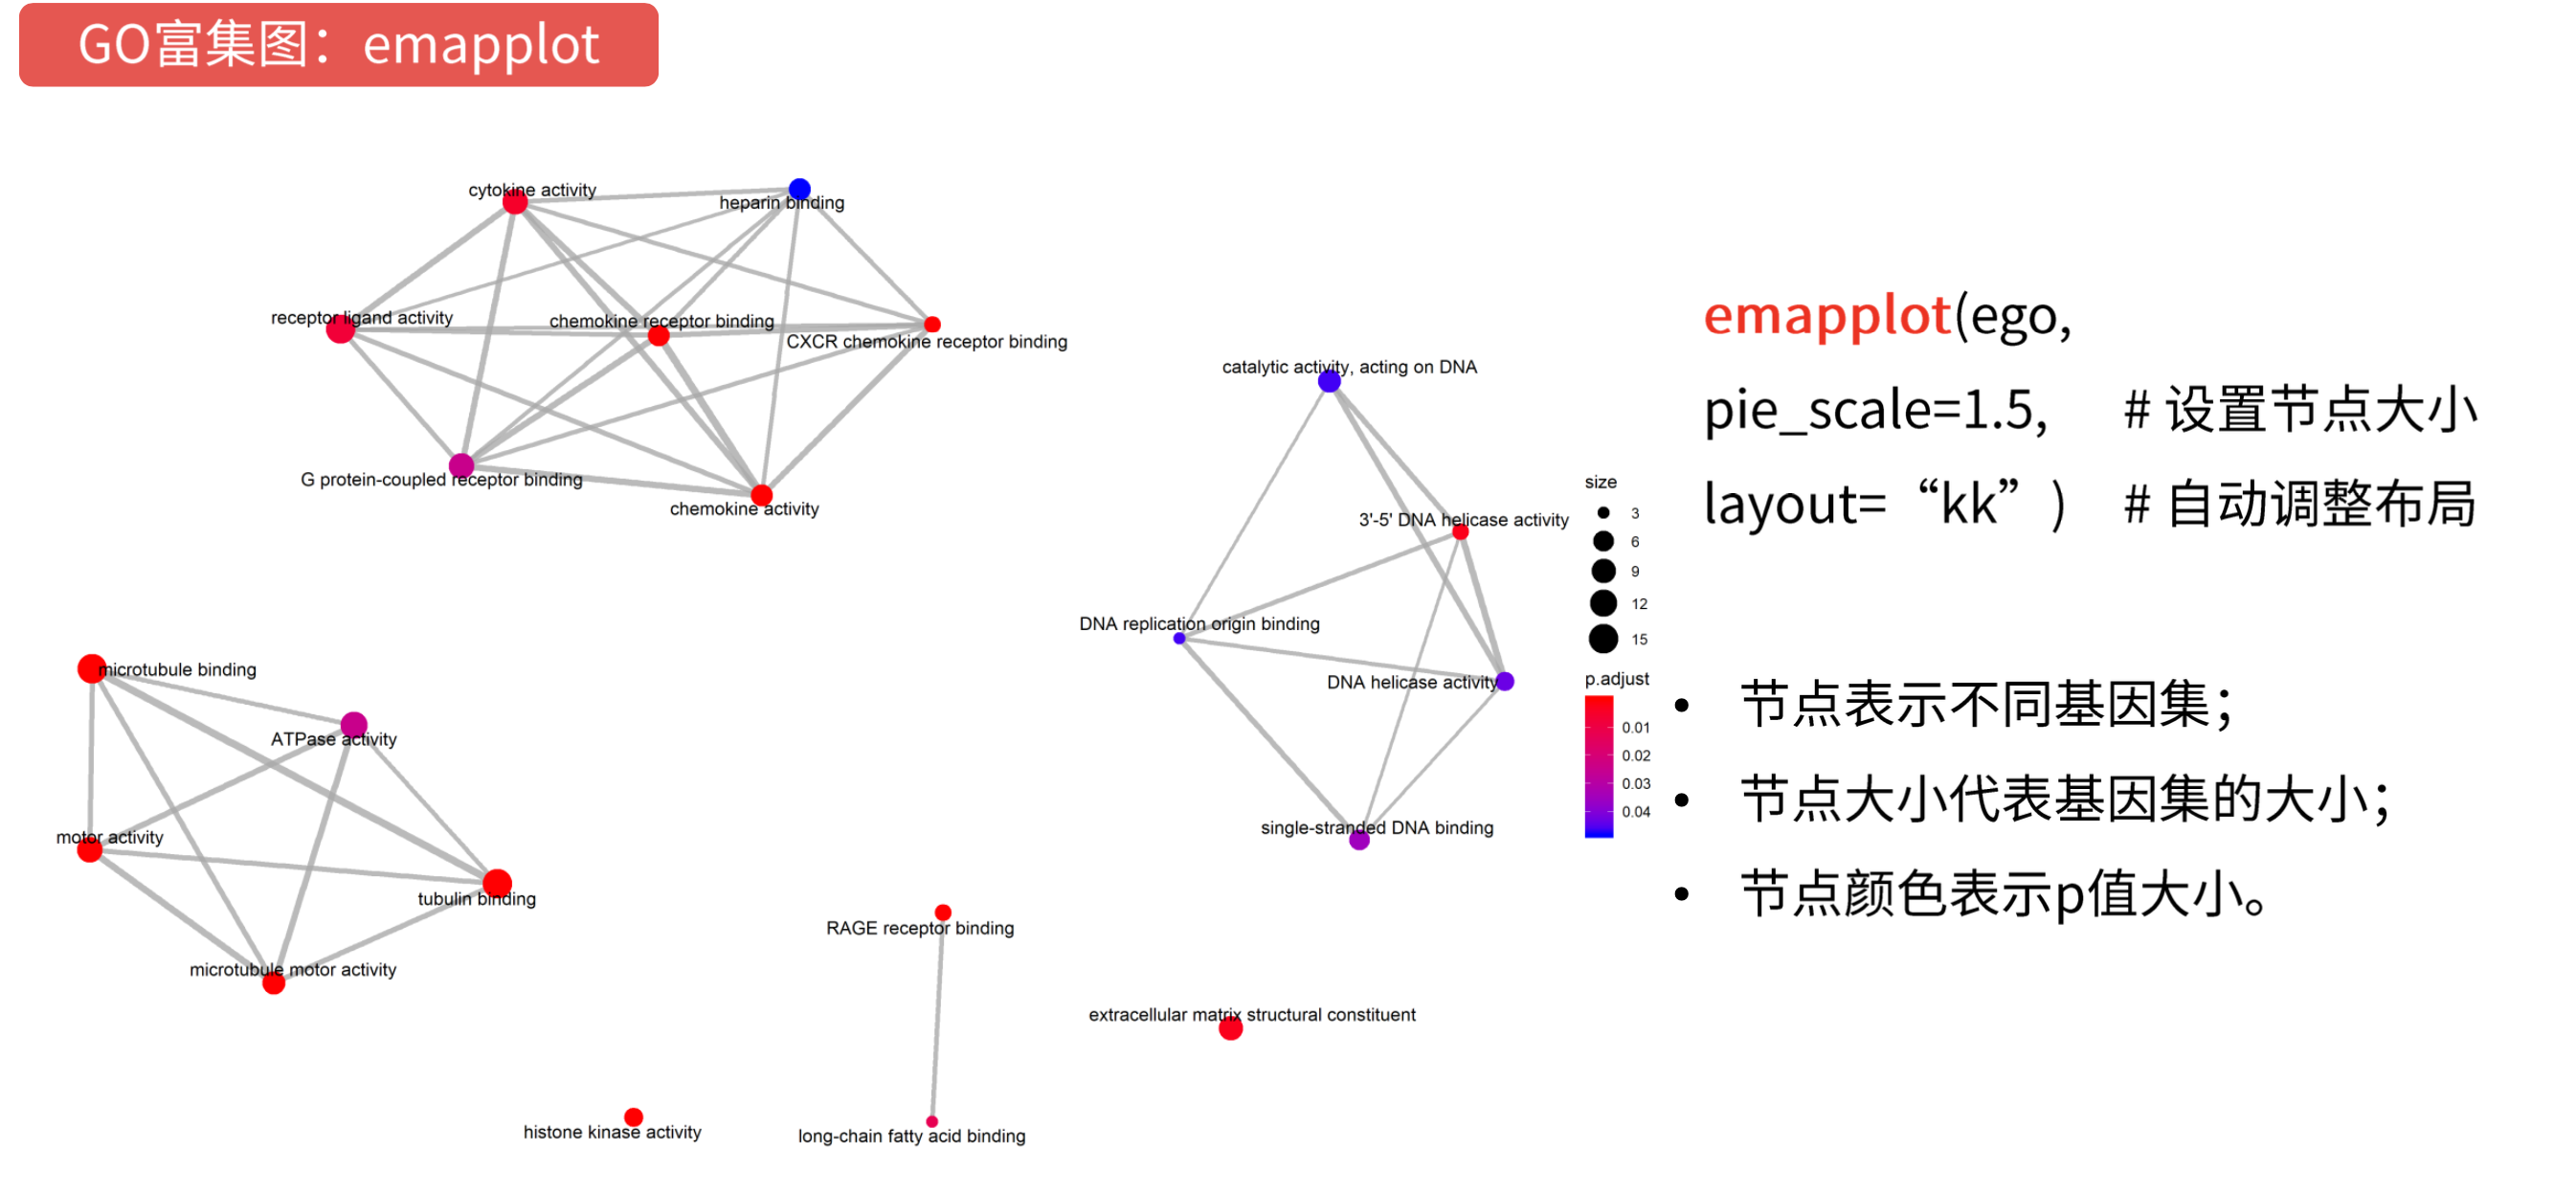

1 | emapplot(pairwise_termsim(go)) |
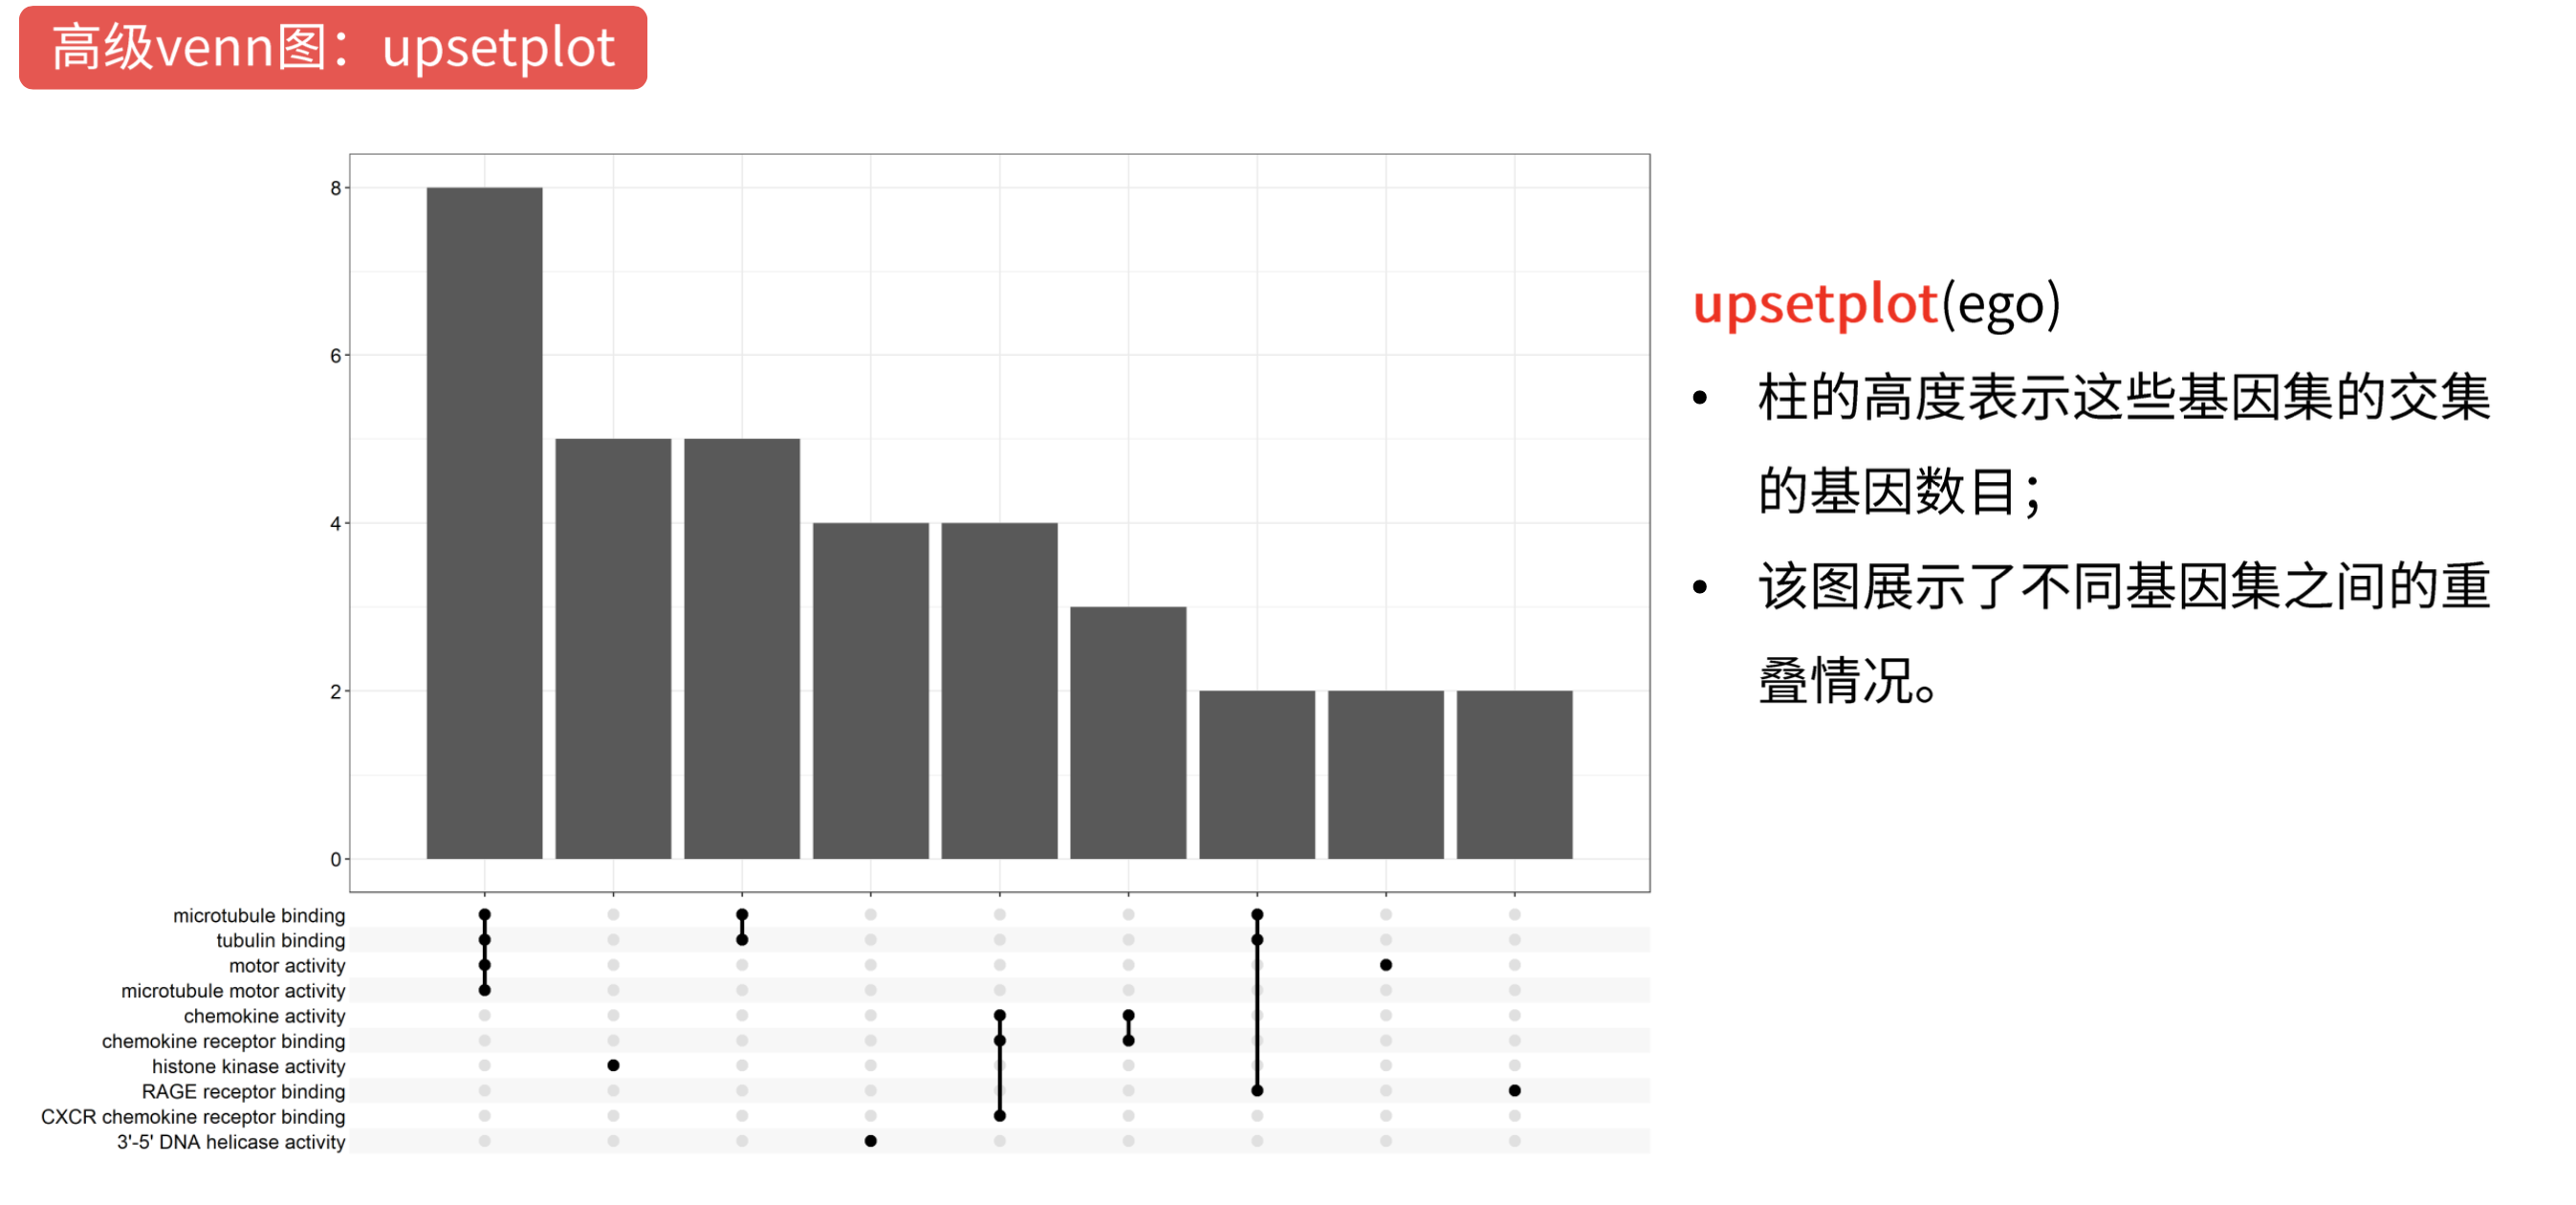
1 | upsetplot(go) |